StarSea
Jul 23, 2014
Writing Feedback / IELTS writing 1: meat and poultry consumption [2]
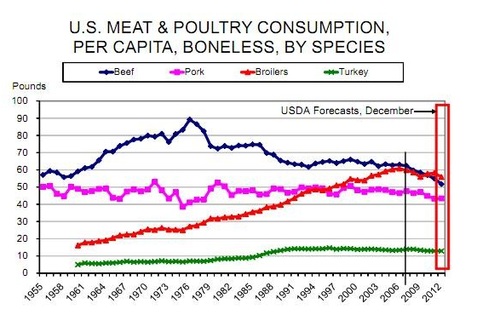
Question: The graph below shows trends in US meat and poultry consumption.
(ignore the forecast and treat 2012 as a past year)
=====================================================
My answer:
The line graph compares the per capita consumption of different meat, namely beef, pork, brollers and turkey in each year in the US.
It is clear that beef was by far the most popular of 4 types of meat for the majority of the 57-year period, whereas turkey was least popular. Another noticeable feature is that the average consumption of beef and brollers varied considerably, while the figures for turkey and pork remained relatively stable over the period as a whole.
Between the years of 1961 and 1976, the beef yearly consumption per capita increased dramatically, to a maximum of just under 90 pounds in 1976. During the same period, the pork's figures fluctuated between 40 and 50 pounds whereas the figures for turkey remained below 10 pounds.
After 1976, beef saw a considerable decrease in its yearly per person consumption, reaching approximately 50 pounds by the end of 2012. By contrast, the figures for brollers peaked in the year 2009 at just under 60 pounds, before falling back to 55 pounds per person per year in 2012. There were no significant changes in the trends for turkey and pork.

1.jpg
