Unanswered [14] | Urgent [0]
  

Posts by akmalnov [Suspended]
Name: Akmal Novizar
Joined: May 12, 2016
Last Post: May 15, 2016
Threads: 3
Posts: 6  
Likes:
From: Indonesia
School: Universitas Gadjah Mada

Displayed posts: 9
sort: Latest first   Oldest first  | 
akmalnov   
May 15, 2016
Writing Feedback / The number of fliers who use three main airports in New York City - IELTS Writing Task 1 [3]

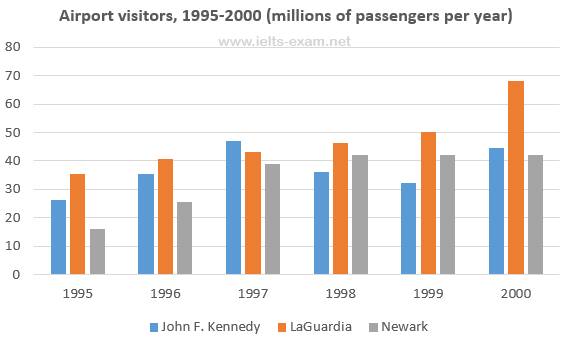
The bar chart depicts the number of fliers who use three main airports in New York City to travel during a 5-year period from 1995 to 2000. Overall, most of the time travelers were usually airborne from LaGuardia airport. However, travelers were more infrequent departed from Newark airport

A further look to the data between 1995 and 2000, LaGuardia passenger's number growth gradually from 35 percent to 70 percent within 5 years. Likely, Newark airport reveals the improvement from 1995 to 1998 and continued stable to the end of of period. While the figures for John F. Kennedy airport fluctuated between 28 per cent and 48 per cent.

However, the number of fliers at John F. Kennedy airport are able to surpass the number of LaGuardia airport in 1997 as the highest percentage in an average among the remaining airports. Indicates inconstant proportion peaked by 48 per cent in 1997 compares to LaGuardia airport nearly at 34 percent. There was no significant challenges by Newark passenger's number towards their constant percentage.


akmalnov   
May 15, 2016
Writing Feedback / The pie charts compare the percentages of different age groups in the population of Yemen and Italy, [9]

Hi fellas,

I wondering if there mentioning prediction year on you essay. In this case, you should use future tense to informs the reader. For example:

- but their percentage iswill predicted to fall to 37 per cent byin 2050
- it is clear from the charts that Yemen are going towill have more adults in 2050

I hope you take that as an advantages due to my little assistance to enhance your better skill in writing ;)
akmalnov   
May 15, 2016
Writing Feedback / Task 1: The comparison of Australian residents who visit four different public places [3]

Hi Maya,

I thought you have to recheck every spelling errors on your essay. I notice a bit mistakes on spelling word Form instead of From . Because of form and from speaks in different meaning and definition, this could ruin the original meaning of the entire sentences.

I hope you can take the advantages due to my little assistance to enhance your writing skills :D
akmalnov   
May 15, 2016
Writing Feedback / In the recent years, children behavioural problems have dramatically propelled. [8]

Hi theodore,

Regarding to your essay, I noticed a few words need to be replace:

- Some many evenMany of themplacedput their children at a childcare centre ...
- Some typos or word errors in behaviou ral. instead of behavioral

I hope you can take the advantages due to my little assistence to improve your writing skills. Thanks :D
akmalnov   
May 15, 2016
Writing Feedback / The number of user who access differently to the two new music sites - IELTS Writing Task 1 [4]

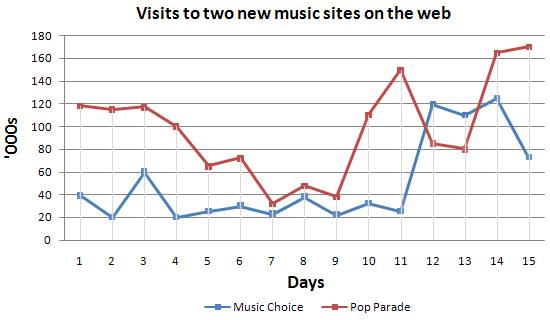
The line graph presents the number of user who access differently to the two new music sites measured within 15 days. Overall, it can be seen that the most popular music website visited by user is Pop Parade website, while Music Choice website becomes more competitive in just couple days.

A closer look from data at the first day to seventh day, more user attempted to access Pop Parade website rather than Music Choice website in corresponding time. Nevertheless, reduction of visitors still occur by the end of period on day 7, where at starting point on day 1 approximately from 120.000 drop to 38.000 visitors. During the same period of time, the figure for Pop Parade website decreased slightly about 20.000 within seven days.

Eventually, by the last period on day 15, the number of Pop Parade visitors hit a peak roughly 165.000. However, the figure for Music Choice in past three days between day 12 and 14 competitively surpass the number of Pop Parade visitors only within a few days.


akmalnov   
May 14, 2016
Writing Feedback / IELTS TASK 1 - The earth's atmosphere level and its relevant data are illustrated in the diagram. [6]

Hi Rere,

As you can see, your essay is adequately understandable.

There are few words in introductory part that I would suggest to swap:

- The earth's atmosphere levellayers .....
- The more length diameter of the earth's atmosphere is, contain the less number of the atmospheric molecule will be

I hope you take some advantages from it, Cheers !! :D
akmalnov   
May 14, 2016
Writing Feedback / The chart below shows the amount of money per week spent on fast foods in Britain. WRITING TASK 1. [6]

Hi max,

Here my feedback to your essay, I identify you missing the paraphrasing question toward the title of your essay concern about. you just right away to explain overall aspect in your introduction part. If you don't mind, here my suggestions of paraphrasing question as an example:

The multiple charts presents the ratio of money spent in three different variant of fast foods: Hamburger, Fish Chips, and Pizza measured by pence per person in a week. Likewise the trend of fast foods usage between 1970 and 1990 in England.
akmalnov   
May 14, 2016
Writing Feedback / The ratio of holidaymaker who visit Brighton attractions in England - IELTS Writing Task 1 [2]

Hi guys, I'm new here, I wish to improve my IELTS writing skills, please kindly share your feedback and suggestions by this essay to produce a good milestone ahead. Thanks again, cheers !!

Here the question:

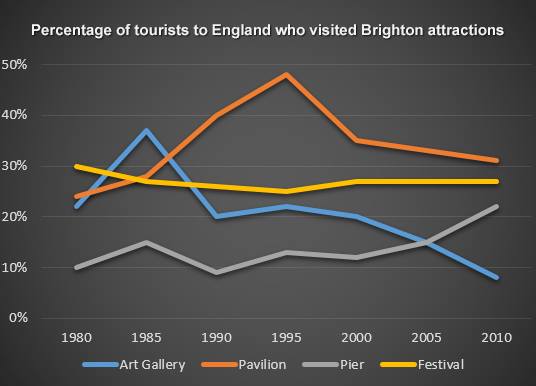
The line graph below shows the percentage of tourists to England who visited four different attractions in Brighton

My answer:

The graph presents the ratio of holidaymaker who visit Brighton attractions in England consists of four different common places: Art Gallery, Pavilion, Pier and Festival between 1980 and 2010, a 30 - year period. Overall, more people went to Pavilion as the most visited among the three remaining places, while the figure of Art Gallery showed reverse.

A further observation between 1980 and 1995 informed tourists who visit Pavilion increased significantly about 50 % in 1995. During the same period, Art Gallery climbed down the percentage after reach a 38 % in 1985 to 22 % in 1995. Similarly, Festival spot also occurred a slight decrease of 25 % in 1995 while the figure of Pier spot fluctuated between 10 % and 15 %.

In next future years by 2010, the percentage of Pavilion started to gradual decline from 50 % in 1995 to 31 % in 2010 as well as Art Gallery dropped the ratio into 8 % in corresponding period. However, the figure for Pier ended significantly toward important improvement of 22 % in 2010 and also there was no significant improvement by the figure of Festival ratio over the period as a whole.


Writing
Editing Help?
Fill in one of the forms below to get professional help with your assignments:

Graduate Writing / Editing:
GraduateWriter form ◳

Best Essay Service:
CustomPapers form ◳

Excellence in Editing:
Rose Editing ◳

AI-Paper Rewriting:
Robot Rewrite ◳