Unanswered [6] | Urgent [0]
  

Posts by yunana
Name: NIENYU CHIANG
Joined: Jul 6, 2016
Last Post: Jul 12, 2016
Threads: 3
Posts: 6  
From: Taiwan
School: Tainan Arts the of University National

Displayed posts: 9
sort: Latest first   Oldest first  | 
yunana   
Jul 12, 2016
Writing Feedback / IELTS Task 1 (Practice) they traveled abroad and why they traveled for the period 1994-98 [3]

The first chart below shows the results of a survey which sampled a cross-section of 100,000 people asking if they traveled abroad and why they traveled for the period 1994-98. The second chart shows their destinations over the same period.

The bar charts compare the numbers of visitors in terms of their reasons and areas from 1995 to 1998.

It is clear that holiday reason was the most for people comparing to other reasons. We can see that Western Europe was much more popular among areas.

According to the table, in 1998, traveling abroad by holiday reason reached 19,703 people, which was almost three times number of business, visits to friends and relatives and other reasons. In addition, traveling abroad by other reasons were the lowest just only 1,054 people. In 1996, only traveling abroad by business rose, while those of holiday, visits to friends and relatives and other reasons fall.

Looking at the areas pie chart, we can see that the majority of people traveling Wester Europe was over 18,000 people. However, traveling in North American and other areas were under 2,500 people. Overall, traveling abroad rose gradually between 1994 and 1998.
yunana   
Jul 9, 2016
Writing Feedback / IELTS Task 1 (Practice) Results number of vistors to Ashdown Museum [7]

The table compares the number of visitors to Ashdown Museum in terms of refurbishment during the year before and the year after. The charts give information about visitor satisfaction rates among five types of feeling.

Overall, visitors of before refurbishment are much more than those of after refurbishment. It increase 18,000 people.

Looking at the satisfaction pie chart, year before refurbishment, we can see that the numbers of dissatisfied and very dissatisfied are much more than those of satisfied and very satisfied. The majority of visitors are dissatisfied accounting for 40%. The second is visitors of satisfied with 30%.

Year of refurbishment, the majority of visitors are very satisfied and satisfied, with 35% and 40% respectively.
By contrast, the numbers of dissatisfied have fallen by 25%. Then the numbers of very dissatisfied are only 5%. It notices about that the numbers of no response remain 5%.

i66.tinypic.com/34pyxll.png
yunana   
Jul 9, 2016
Undergraduate / Autobiography - Simple Introduce myself [6]

It is very lucky having two sisters like them.
When I was child, I often went to the library for reading it.

I am not consider my self good writer but I think other people may help you more
yunana   
Jul 7, 2016
Student Talk / Is it necessary to learn English? [38]

Learning English is very important for me. For example, I could make more friends when I traveled abroad. Then it could make me having a good job. In addition, English is a global language we can not without it.
yunana   
Jul 7, 2016
Undergraduate / Georgetown University essay - discuss extracurricular activity that you are most involved in [7]

It is significant activity I was involved in my work of fostering pets in Distress.
Over the summer, I spent weeks fostering a Rat Terrier named Willard. Willard was a great dog with a lot of energy, sometimes too much energy. He would often jump around the house and chew things such as clothes, including my Alabama Crimson Tide hat.

I loved Willard because he is my favoriate dog, and similar my family.

One thing I love to do in life is to help people.This determination of mine goes for animals as well because, to me, animals, especially dogs, are almost like humans. I do not know your mean, sorry.
yunana   
Jul 7, 2016
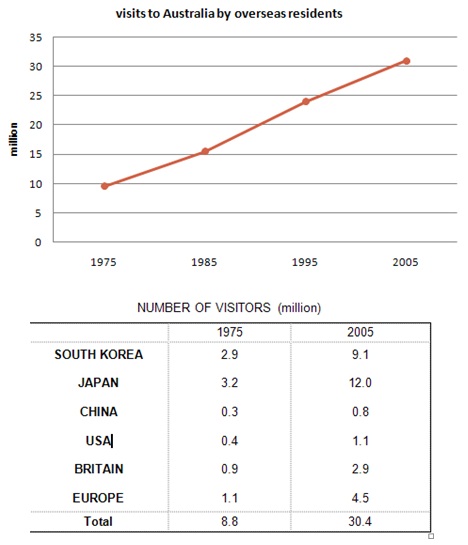
Writing Feedback / IELTS Task 1 (Practice) Number of annual visits to Australia by overseas residents [4]

The line graph shows the number of overseas residents in Australia from 1975 to 2005, and the table compares six countries in terms of the number of visitors.

It is clear that the number of visitors rose gradually to about 10 million people in 1975 and 30 million people in 2005.

According to the table, in 1975, visitors of Japan were the most, while that of China were the lowest with 0.3 million people. The second lower country was USA with 0.4 million people. Visitors of other countries visit to Australia with 0.9~2.9 million people.

In 2005, visit to Australia by Japanese reaching with 12 million people, while visitors of China reached mere 0.8 million people. The second lower country was still USA with 1.1 million people. These figures were nearly fourth times as much as those of Europe. Overall, visitors of East countries were much more than those of west countries.

i66.tinypic.com/s4awpc.jpg


  • Graph
Need Writing or Editing Help?
Fill out one of these forms:

Graduate Writing / Editing:
GraduateWriter form ◳

Best Essay Service:
CustomPapers form ◳

Excellence in Editing:
Rose Editing ◳

AI-Paper Rewriting:
Robot Rewrite ◳

Academic AI Writer:
Custom AI Writer ◳