Hi, I am practicing the writing test for IELTS, would you please give me some comments for my works?
In addition, I am not sure if I can present the data in the form of "has rose from 30-35%, 15-20% and 10-15% respectively." and "the percentage has fell into a half from 2000 (20%) to 2010 (10%)" is correct. Also, I do not know if the tenses I used is correct.
Thank you very much!
Question:
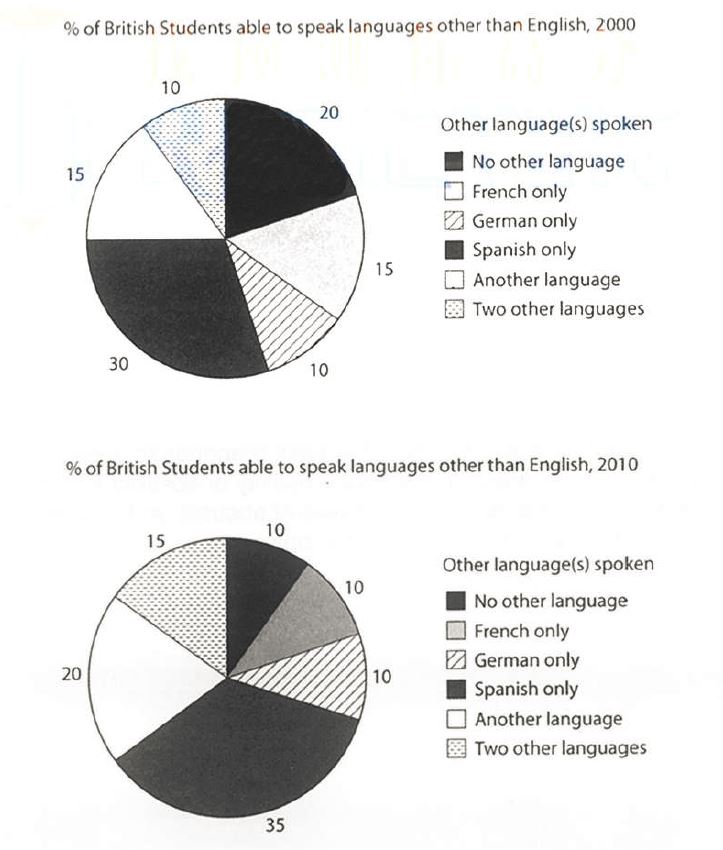
The charts below show the proportions of British students at one university in England who were able to speak other languages in addition to English, in 2000 and 2010.
Summarize the information by selecting and reporting the main features, and make comparisons where relevant.
Answer:
The charts report the percentage of British students who can speak various languages in a particular university in 2000 and 2010 respectively.
Looking at the students who can speak Spanish only, another language and two other languages first. It can be observed that there is a 5% increase for each group of students from 2000 to 2010. From 2000 to 2010, the percentage of students who can speak Spanish only, another languages and two other languages has rose from 30-35%, 15-20% and 10-15% respectively.
With regard to students who can speak French only and no other language, the percentage of students result a falls from 2000 to 2010. For students who cannot speak other languages, the percentage has fell into a half from 2000 (20%) to 2010 (10%). For students who can speak French only, the percentage has dropped from 15% in 2000 to 10% in 2010.
For the students who can speak German only, the percentage keep unchanged at 10% in 2000 and 2010.
According to the above data, it can be found that over 80% and 90% of British students can speak at least two kinds of languages in 2000 and 2010 respectively. Furthermore, around one-third of the students can speak Spanish which leads Spanish to become the most common second language for British students in both 2000 and 2010.
In addition, I am not sure if I can present the data in the form of "has rose from 30-35%, 15-20% and 10-15% respectively." and "the percentage has fell into a half from 2000 (20%) to 2010 (10%)" is correct. Also, I do not know if the tenses I used is correct.
Thank you very much!
Question:
The charts below show the proportions of British students at one university in England who were able to speak other languages in addition to English, in 2000 and 2010.
Summarize the information by selecting and reporting the main features, and make comparisons where relevant.
Answer:
Which foreign languages British students know?
The charts report the percentage of British students who can speak various languages in a particular university in 2000 and 2010 respectively.
Looking at the students who can speak Spanish only, another language and two other languages first. It can be observed that there is a 5% increase for each group of students from 2000 to 2010. From 2000 to 2010, the percentage of students who can speak Spanish only, another languages and two other languages has rose from 30-35%, 15-20% and 10-15% respectively.
With regard to students who can speak French only and no other language, the percentage of students result a falls from 2000 to 2010. For students who cannot speak other languages, the percentage has fell into a half from 2000 (20%) to 2010 (10%). For students who can speak French only, the percentage has dropped from 15% in 2000 to 10% in 2010.
For the students who can speak German only, the percentage keep unchanged at 10% in 2000 and 2010.
According to the above data, it can be found that over 80% and 90% of British students can speak at least two kinds of languages in 2000 and 2010 respectively. Furthermore, around one-third of the students can speak Spanish which leads Spanish to become the most common second language for British students in both 2000 and 2010.

IELTS_11__Test_2_Ta.jpg
