Any comments and corrections are deeply appreciated, thank you in advance !
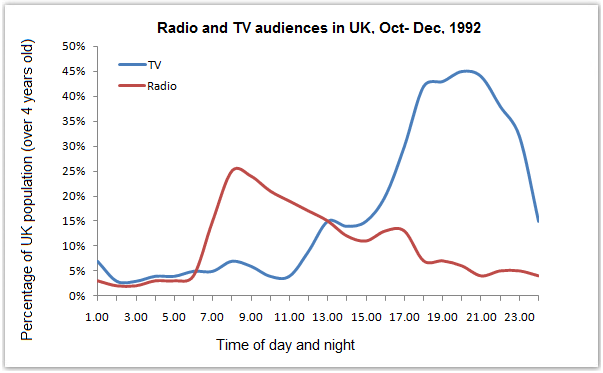
The graph below shows radio and television audiences of United Kingdom throughout the day in the year 1992. Write a report for a university lecturer describing the information shown below.
television viewers and radio listeners in UK
The provided line graph depicts the daily audiences percentage of United Kingdom radio and television during October to December in 1992. As can be seen, both media has their peak point in the completely different time of the day. While radio has it during the morning, television has them when the night comes.
Both line graphs started almost at the same percetage value with only a slight difference in number. Comes the morning, a dramatical change was occured in the graph representing the radio listeners. A rise to 25% made the chart in stark contrast to those of television audiences, which remained steady as its preceeding trend. It was not until around 9 AM that the television audiences percentage started to rose.
From then on, the television viewer gradually inclined until 3 PM where it suddenly doubled, and reached a percentage of over 40% of viewers by 8PM. In contrast, the radio audiences percentage started to fall down by 9 AM and carried on until the end of the day.
(170 words)

LINE_GRAPH_TV_RADIO.png
