Here are two writings I've written in different ways to address the details of the figures. Would you please let me know your comments on them and also which one is better? Thank you in advance
Question
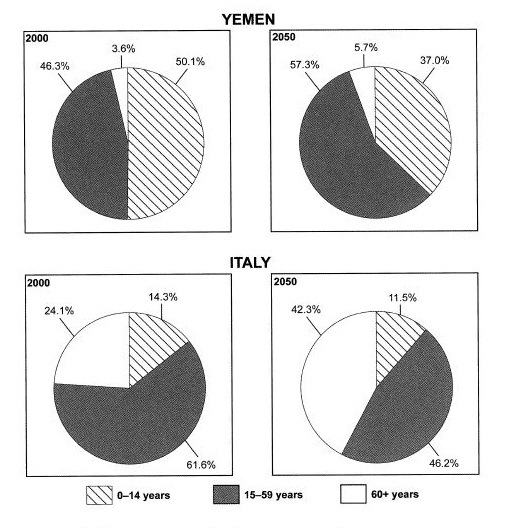
The charts below give information on the ages of the populations of Yemen and Italy in 2000 and projections for 2050.
Summarise the information by selecting and reporting the main features, and make comparisons where relevant.
(1)
The pie charts give figures on population ages categorized into three different ranges in 2000 for a developed, Italy, and a developing, Yemen, countries and also a prediction for 2050.
Almost half of the population of Yemen was under 14 in 2000. Approximately, the same amount accounted for adults as high as 46.3%, while a mere of 3.6% was above 60 years. The projection shows some control scheme has been successfully taking measure; as a result, the population of infants to adolescents group will moderately increase by 13% nearly. The 15-59 years group expectedly will have raise of 11%. Additionally, the elderly percentage increasingly reaches at 5.7% in 2050.
In Italy, adult population constituted 61.6% in 2000 while it will decrease slightly to 46.2% on 2050. In the contrast, 2050 proportion of the 60s will rise warningly from 24.1% in 2000 to the twice for the next 50 years. Moreover, the birth rate will reduce between 2000 and 2050, by about 3% as a result of reduction happening for less than 14 years population from 14.3 to 11.5% over these years.
Overall, Italian adults and elderlies populations alarmingly will increase to become an overwhelming majority of its population.
Words number: 194
(2)
These figures show the Yemeni and Italian proportions through three age groups in 2000 and also the prediction for the following half century.
People of Italy was older than Yemeni in 2000; furthermore, the same is predicted for the next 50 years. Additionally, the age of individuals of both countries will be increased on 2050.
In addition to the greater proportion of under 14-year-old Yemeni than those for Italian - the former consisted just over half the whole and the latter around 14%- , the aged citizens of Yemen, who were 60+, contributed a mere of 3.6%, whereas a quarter of Italian inhabitants was constituted by elderlies. Moreover, adults, who were under 59, accounted for the largest percentage of Yemeni and Italian populations as great as 46.3% and 61.6%, respectively.
The estimation demonstrates that in a spite of nearly 13% reduction of the under 14 chunk from 2000 to 2050, the average ages of people in Yemen will rise as a result of enlarging in number of elderlies and adults by 30% and 11% approximately. It is envisaged that percentage of Italian people over 60 years will surge to about twice as high as the percent was in 2000, 24.1%. However, the amount of the 15-50 year group will be faced with a dramatic drop of more or less 14% and a slight decline of about 3% will occur for infant and adolescent group.
Words number:233

Figure IELTS9
