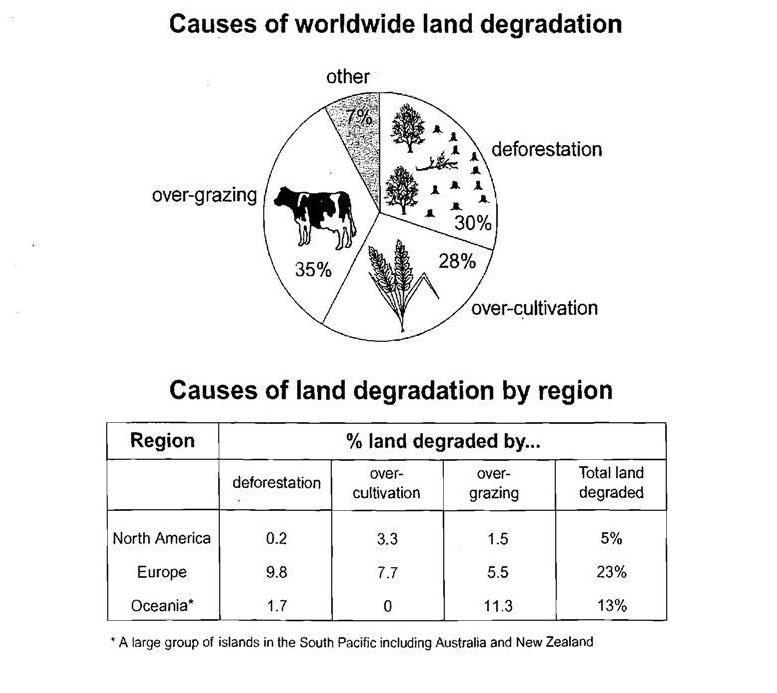
The pie chart below shows the main reasons why agricultural land becomes less productive. The table shows how these causes affected three regions of the world during the 1990s. Summarize the in formation by selecting and reporting the main features, and make comparisons where relevant.
Two chart and table given reveal the main causes of land degradation in the world and in three regions namely North America, Europe and Oceania in the 90s.
It is apparent that, the major activity leading to worldwide counterproductive agricultural land was overgrazing, which made up 35%. Deforestation and over-cultivation were the second and the third with 30% and 28% respectively, leaving 7 % for other reasons.
On the other hand, the causes of land degradation were different for various regions. As can be seen from the table, Europe had the largest proportion of land degraded, less than a quarter while this figure was 13% for Oceania and just 5 per cent for North America. Out of the percentage of degraded land in Europe, approximately a tenth was result of deforestation and about 8 percent was due to over-cultivation. By contrast, virtually 0% of counterproductive agricultural land was led by deforestation in North America and by over-cultivating in Oceania. It is interesting to note that overgrazing accounted for 11.3% of causing degraded land in Oceania, almost doubling than figure in Europe and much higher than one in North America.

pie_chart_and_table..jpg
