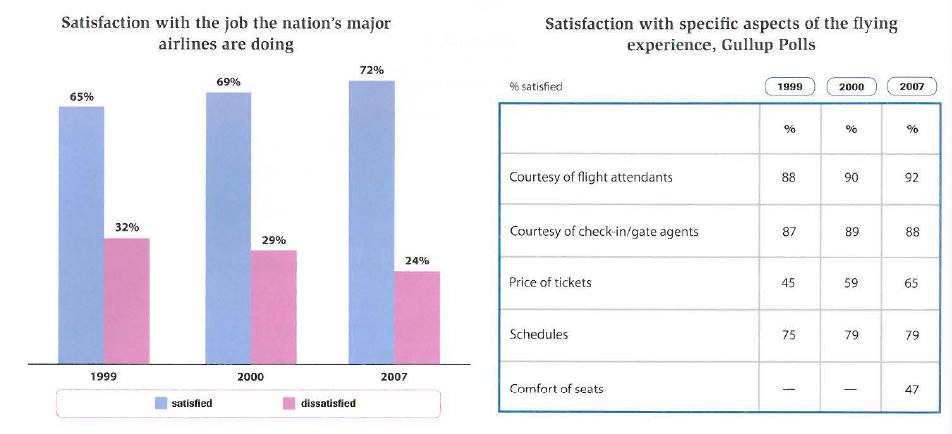
The bar chart and table illustrate satisfaction levels of passengers in the United State with airlines and which aspect makes them satisfied in there selected years 1999, 2000, and 2007. Overall, it can be seen that, majority of passengers were satisfied in the rest of years and courtesy of flight attendants was the highest percentage of satisfaction of the flying experience.
To begin with, in the three-year period, there was a significant increase in satisfaction of costumers and the highest percentage of satisfaction was in 2007, 72 percent. However, fortunately, people feeling dissatisfied were more and more dramatic decrease and the lowest was in the following year at 24%.
On the other data, courtesy and price experienced a slight rise although courtesy of flight attendants was the majority aspect all years selected. Schedule was another aspect having an increase, yet in following year, there was a level off at 79 percent. Interestingly, a comfortable seat was an important aspect in 2007 in which 47 percent people chose this as an aspect, compared to two years earlier when there was no one choosing it.
(183 words)

satisfaction
