the value of one country's exports in various categories
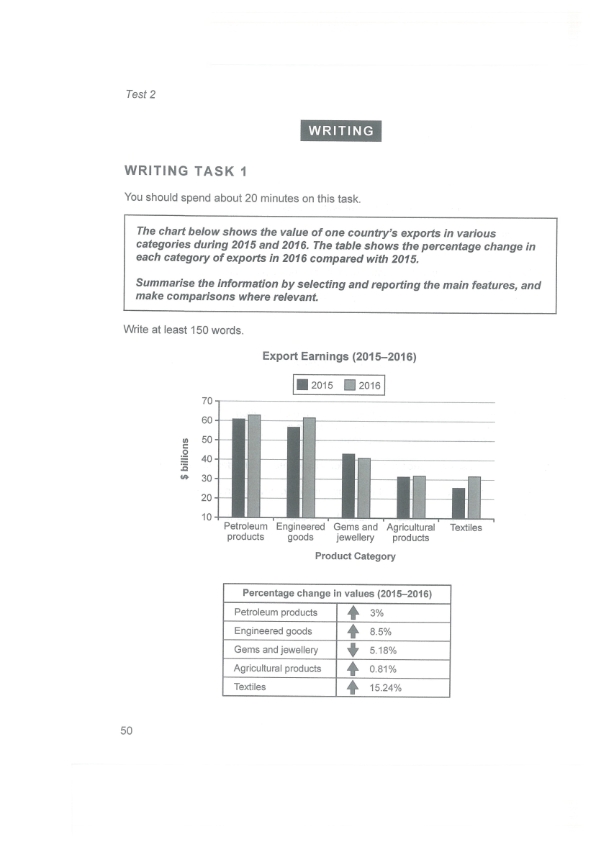
The given table and chart depict the alteration of country's export earning in several products for one year from 2015 to 2016. Data was measured in billion.
Overall, most of the products experienced an increased number, except Gems And jewellery decreased during the period given. Petroleum products contributed the biggest amount, while textile and engineered goods made a significant rise.
To begin with, the petroleum products started at 61 billion in 2015 and rose as many as 3 % becoming 63% in 2016. Besides, engineered goods stood at nearly 56 billion and experienced a considerably rise number as many as 8.5% after one year.
Unlike the two previous products, the others categories showed low number. There was only a little different number of change in Agricultural products at approximately 31 billion in 2015 and just over 31 billion in 2016.
Interestingly, textiles was the lowest in 2015 which stood at nearly 26%, albeit textiles could jump significantly as many as 15.24%.
Gems and jewellery decreased over the period given. Starting at around 43 billion and had a significant dip (5,18%) in the end of the given period.

CambridgeIELTS14_0.jpg
