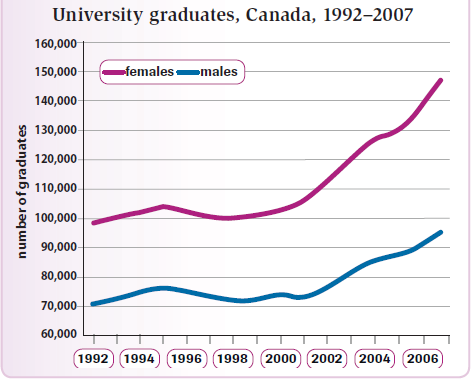
The given line graph indicates alumni quantities over fifteen-year period in Canada based on gender, measured by tens of thousand. At a glance, both figures experienced an upward trend. In any case, female students contributed the highest proportion.
From 1992 to 1995, male and female graduated scholars' numbers showed a slight increase by 5000, yet directly fell to almost 70,000 and 100,000 for male and female respectively in the three following years. Next, the significant changes were seen after 2000 in which alumni numbers increased dramatically to 150,000 by female figures and 100,000 by male figures.
Moreover, female student's level led the trend as in the end of period it rose a half of its starting point and therefore female scholar's quantities reached a peak to 150,000. Meanwhile, even though by 2007 male figures had increased almost by 30,000 as its peak, it only reached the lowest point by females'. Furthermore, the considerable gap was shown in which there were 50,000 women graduate's numbers above men.

228872_1_o.png
