UK telephone calls by three categories
Topic:The chart below shows the total number of minutes (in billion) of telephone calls in the UK, divided into three categories, from 1995-2002.
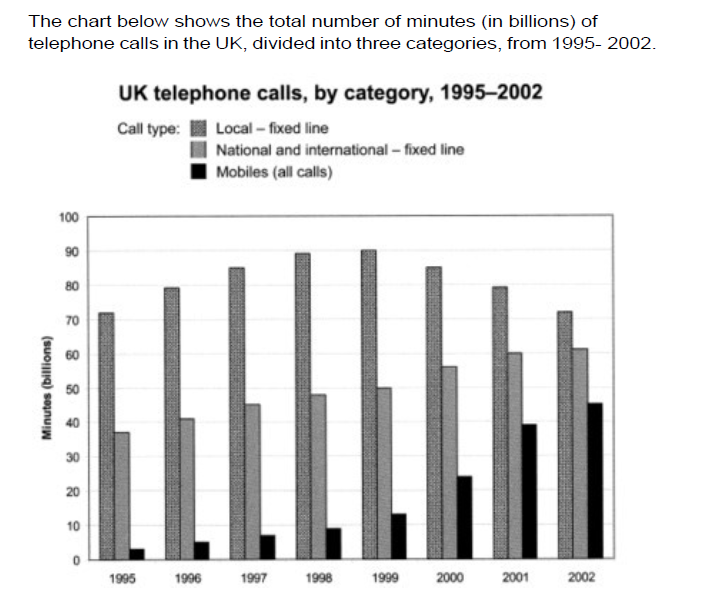
The chart compares the amount of time spent by people in the UK in three categories over the seven-year period starting in 1995 and finishing in 2002.
Overall, it can be seen that there was an upward trend in fixed line (national and international) and mobiles from 1995 to 2002. Besides, although the number of minutes of local call was the highest in the period shown, it experienced a downward trend in the last four years.
In the year 1995, the category of fixed line (national and international) and mobiles calls had increased gradually. To be more specific, there were about 35 billion minutes of national and international calls in the first year, and the number kept rising to just over 60 billion minutes in 2002. In terms of mobiles calls, only less than 5 billion minutes in 1995, however, the number increased rapidly and reached its peak in the year 2002, at just over 45 billion minutes.
With regard to local fixed line, the figure for it had increased steadily, from around 70 billion minutes in 1995 to 90 billion minutes (which was the highest point) in 1999, a rise of 20 billion minutes. After that, the figures for local fixed line fell, only approximately 72 billion minutes in the last year of the period.

Capture.PNG
