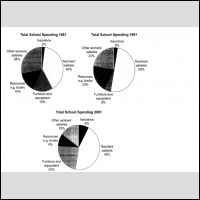
The three pie charts illustrate the figure of annual expenditure of a particular british school in 1981,1991 and 2001.
In all three years the greatest expenditure on staff salaries. but while other workers' salaries declined from 28% in 1981 to 15% in 2001, teachers' salaries remained the biggest cost , occupied 50% of total spending in 1991 and slightly dropped to 45% in 2001.
Furthermore, Insurance occupied the least percentage of school budget but it shows an upward trend,went from 2% in 1981 to 8% in 2001.
Expenditure on resources such as books had rose to 20% by 1991 before decreasing to 9% in 2001. whereas, the cost of expenditure and equipment shows an opposite trend. this cost decreased to only 5% in 1991 but rose dramatically in 2001 when it constituted 23% of the school budget.
I look forward to hearing from you.

