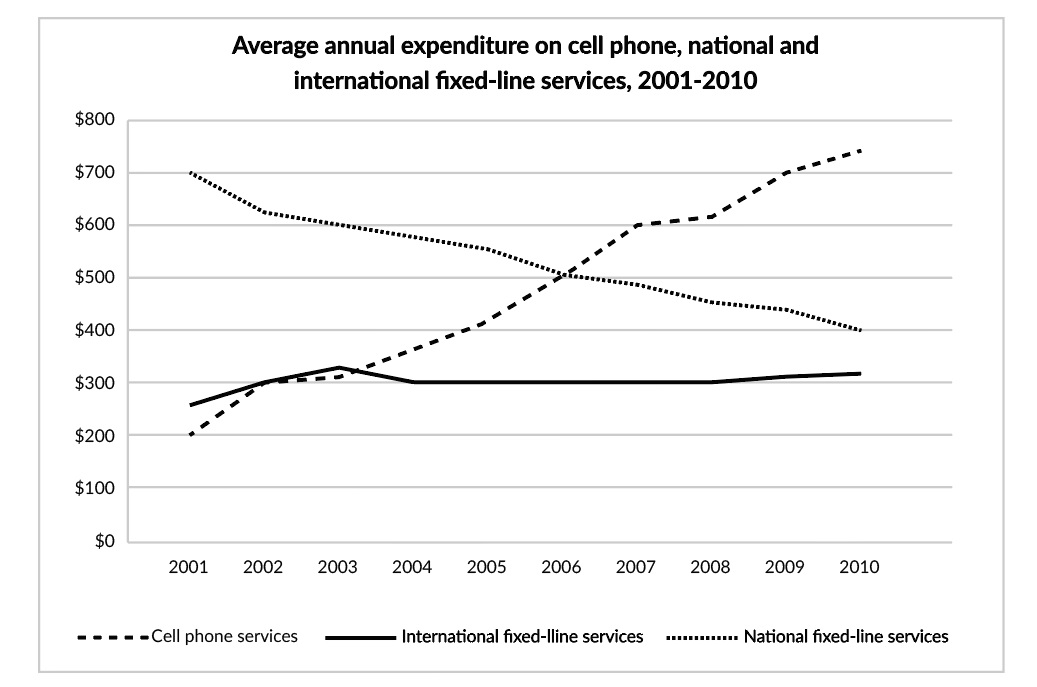
spendings on on mobile phone, domestic and global fixed-line services
The following line graph visualizes the yearly expense on mobile phone, domestic and global fixed-line services of the USA from 2000 and 2010.
Overall, the figure of phone services had a tendency to decline gradually by the time. Meanwhile, the interior fixed-line services pattern grew up significantly. On the contrary, the worldwide one did not change by the time.
Turning to the mobile phone statistic, its price was reach nearly the peak in 2001 with $700 in 2001. Throughout the time, its cost declined imperatively about $50 each year. Subsequently, it only correctly $400 in 2010. However, the expense for the domestic service was just $200, which was also the lowest price in the graph. Subsequently, its cost suddenly grew up nearly $50 in each year to be the peak of the illustration with approximately $750.
Lastly, the international figure just increased slightly from 2001 to 2003, which was from $250 to $320. About the rest of the time period, the line of the worldwide expenditure was merely straight by the time and it were $300.

Screenshot10.png
