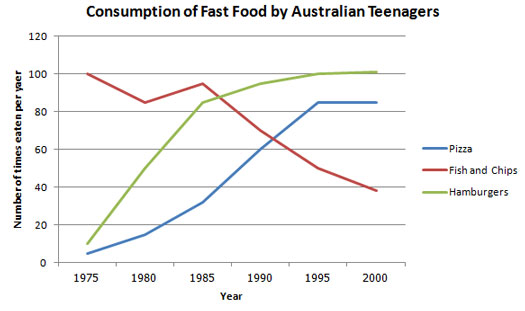
The line graph below shows changes in the amount and type of fast food consumed by Australian teenagers from 1975 to 2000.
Summarize the information by selecting and reporting the main features and make comparisons where relevant.
This is my first attempt practicing on writing IELTS' Task 1 essay.
The graph shows the consumption of fast food by Australian teenagers during 1975 until 2000. It displays the number of eaten per year for pizza, fish and chips and hamburgers within the period.
Overall fish and chips were eaten the most at the beginning of the period even though after two years, it decreased. In contrast, both pizza and hamburgers were eaten less at the beginning of the period but gradually they raised the number of eaten per year from the middle of the period.
Fish and chips were eaten 100 times per year in 1975 when pizza and hamburgers were at the bottom of the graph which were below 20. The former decreased five years later even though raised back again after that. However, in 1985 it dived down slightly below 40 times a year in 2000.
On the other hand, the rest of the fast food both raised constantly without going down even once. Fish and chips raised 100 in 2000 becoming the most eaten fast food. The later stopped raising in 1995 at 82, constantly stable in the position until 2000.
Summarize the information by selecting and reporting the main features and make comparisons where relevant.
This is my first attempt practicing on writing IELTS' Task 1 essay.
Fish and chips on antipodes
The graph shows the consumption of fast food by Australian teenagers during 1975 until 2000. It displays the number of eaten per year for pizza, fish and chips and hamburgers within the period.
Overall fish and chips were eaten the most at the beginning of the period even though after two years, it decreased. In contrast, both pizza and hamburgers were eaten less at the beginning of the period but gradually they raised the number of eaten per year from the middle of the period.
Fish and chips were eaten 100 times per year in 1975 when pizza and hamburgers were at the bottom of the graph which were below 20. The former decreased five years later even though raised back again after that. However, in 1985 it dived down slightly below 40 times a year in 2000.
On the other hand, the rest of the fast food both raised constantly without going down even once. Fish and chips raised 100 in 2000 becoming the most eaten fast food. The later stopped raising in 1995 at 82, constantly stable in the position until 2000.

Graph
