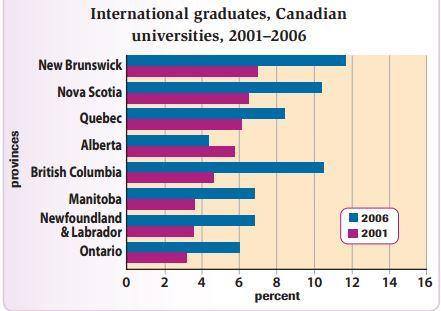
A breakdown of the proportion of international students graduating from universities located in different Canadian provinces from 2001 to 2006 is presented in the bar chart. Overall, by far the majority of foreign students graduated from universities in New Brunswick. However, in comparison with the number of graduates in 2001, the 2006 figure rose considerably in almost all provinces, but this was not likely to happen in Alberta.
Initially, the percentage of international graduates in New Brunswick stood at 7%. But then by 2006, it had increased by just over 4%. This had been represented as the greatest foreign graduates number in Canada. The lowest, however, had been seen in Ontario. Although the cohort of international students graduating from this province in 2006 showed twofold more than the 2001 figure, this had not sufficiently made it surpassing the proportion in the other provinces.
A more detailed look at the graph reveals that almost all provinces experienced an upward in the bracket of non-Canadian graduates. These differences were varies, yet a significant change was seen in British Columbia, when the figure rose from 4.8% to 10.2%. Meanwhile, the number of international students graduating from universities in Manitoba and Newfoundland & Labrador were stagnant for the first and second year, 3.8% and 6.8% respectively. Interestingly, Alberta witnessed a converse trend. At first, it stood at 5.8% and then decreased by 1.6% in 2006.

12570927_10208852863.jpg
