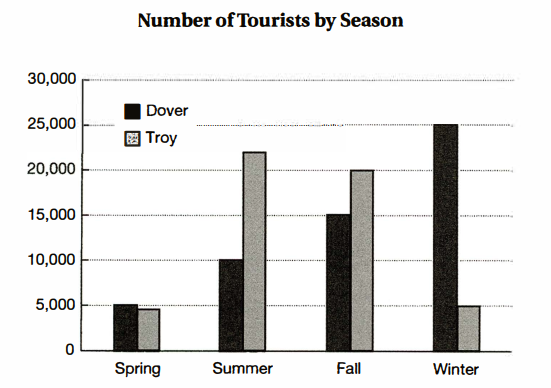
The Bar graph shows the number of tourists visiting two different cities by seasons
tourists in dover and troy
There was a fluctuation in the number of tourists visiting Troy in four seasons. Under 5000 tourists in spring was the lowest number. Then there was a considerably increase of tourists in summer and it peaked at 22.000 at that time. The last two seasons of the years were the time this number decreased to 5000 in the winter.
On the other hand, people spent time visiting Dover most in winter. Spring was the time in which people visited Dover least and this number reached the bottom at 5000. The next two seasons witnessed the sharp increase in the number of tourists from 5000 to 15000 in the fall. After that, this number rose again and peaked at 25000 in winter.

Capture.PNG
Holt Educational Consultant - / 16019 The task 1 essay uses a 3 paragraph format for its information analysis and presentation. You only have two paragraphs comprising 121 words. This analysis paper is not well written. It lacks a proper analysis that would have allowed you to reach the minimum 150 word count. The deduction percentage for the lacking words will be just too high for this essay to reach a baseline passing score. So, what was missing from this essay? You forgot to include a summary overview as the first paragraph. You dove directly into an analysis of the information, which led to the lacking word count. The analysis itself is acceptable. However, the incorrect format (missing summary overview) is what really had a major effect on the final score of this presentation.
| Home / Writing Feedback / The Bar graph shows the number of tourists visiting two different cities by seasons |
ⓘ Need academic writing help? 100% custom and human!

