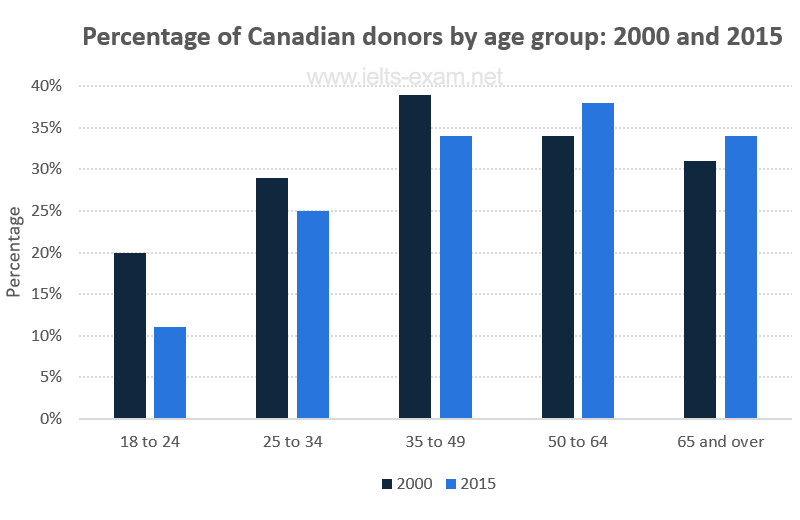
The chart below gives information on the percentage of Canadians gave money to charitable organisations by age range for the years 2000 and 2015.
The grouped bar chart compares the age distribution of the Canadian donating to charity between 2000 and 2015.
Overall, the number of donors concentrated on the 25 to 64 age groups and that concentration dropped subtantially in two younger groups. In addition, the late middle age and elderly people witnessed an increase in the data, which was in stark contrast to the rest.
Specifically, the 2000 survey of people aged from 18 to 49 revealed a difference of about 10% between adjacent bars ranging from 20% to 40%. After 15 years, the percentage of people aged 25 to 34 and 35 to 49 witnessed a marginal decline to 25% and slighly under 35% respectively, whereas that of the youngest age group was twice less than before (at 10%)
Likewise, there were more and more people over 49 taking part in the charitable donation. They accounted for about 34% and 32% for each in 2000 and recorded a modest rise of around 4%, which the oldest was lower
Summarise the information by selecting and reporting the main features, and make comparisons where relevant.
The grouped bar chart compares the age distribution of the Canadian donating to charity between 2000 and 2015.
Overall, the number of donors concentrated on the 25 to 64 age groups and that concentration dropped subtantially in two younger groups. In addition, the late middle age and elderly people witnessed an increase in the data, which was in stark contrast to the rest.
Specifically, the 2000 survey of people aged from 18 to 49 revealed a difference of about 10% between adjacent bars ranging from 20% to 40%. After 15 years, the percentage of people aged 25 to 34 and 35 to 49 witnessed a marginal decline to 25% and slighly under 35% respectively, whereas that of the youngest age group was twice less than before (at 10%)
Likewise, there were more and more people over 49 taking part in the charitable donation. They accounted for about 34% and 32% for each in 2000 and recorded a modest rise of around 4%, which the oldest was lower

1.jpg.png
