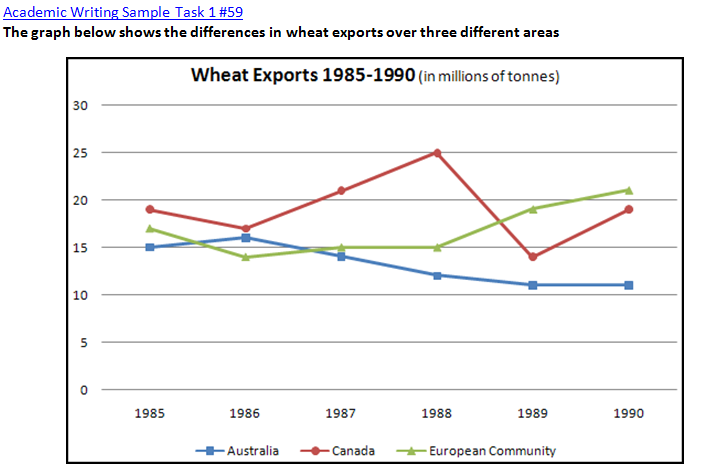
A breakdown of wheat exports in several countries is presented in the line chart from 1985 to 1990. Overall, there were parallel falls in export rates between Australia and Europe countries in the first second period. On the other hand, Canada showed a stable percentage from the beginning of time frame over the period in question.
Between 1985 and 1987, a similar trend was seen by Australia and European communities in wheat exports, regarding a slight decrease. The former went down steadily from 15 to 14 million tonnes, while the latter fell by around a million ton. In contrast, the proportion of Canada's wheat exports rose slowly and reached at over 20 million tonnes.
Interestingly, Canada witnessed an upward trend. The alteration was most noticeable in the third period, when the figure showed a significant increase and peaked at 25 million tonnes. However, this had fallen back to the 1985 figure by 1990. By contrast, the portion of Australia declined gradually at about 10 million tonnes, albeit the other grew up to more than 20 million tonnes. Eventually, a gap between those had widened.
(177 words)

wheat_exports.png
