Foolks, Kindly need your comment to improve my writing,
========================
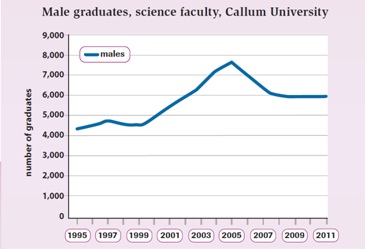
The given line graph shows a breakdown of the number of men pupil graduated from faculty of science, Callum University over a 6-year period from 1995 to 2011.
Overall, it is quite interesting that the change number of male graduates experienced twice both increasing and decreasing.
According to the information provided, after plateau at 4000 in 1995, the number of male students pursuing a degree in the field of science rose slightly to just under 5000 in the next 2 years. This trend then conversely changed toward dip to a little above of its previous position in the beginning in 1999.
A more detailed look at the graph reveals that this change trend continued in the period between 1999 and 2005 and reaching the peak at approximately 7500 at the end of this particular period. This was followed by a period during which numbers dropped considerably and then remained stable at 6000 until 2011.

callum_university.jp.jpg
