money spent on fast foods in britain
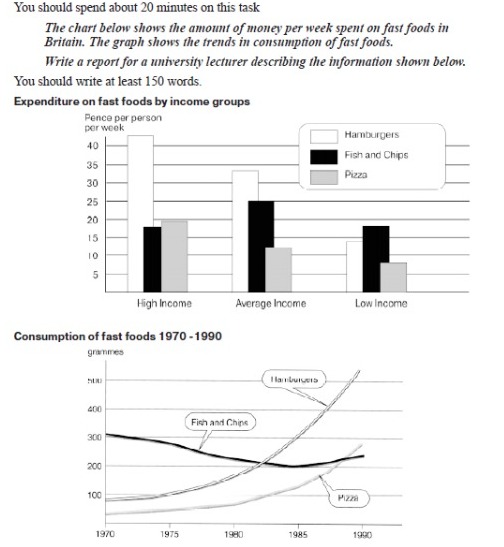
The bar chart illustrates the weekly expenditure on 3 fast food (hamburgers, fish and chips, and pizza) in Pence among the British high, average and income groups whereas the line graph illustrates their use in grammes over the years 1970, 1975, 1980, 1985 and 1990.
Overall the highest amount was spent by the high income group which was for hamburgers while the least amount was spent on pizza by the low income group. The consumption of hamburgers and pizza showed a rise as opposed to the fish and chips consumption over the given period.
The amount spent on the hamburgers was highest in the high income group (more than 40 Pence) which showed a decrease among the average and low income groups accounted around 33 and 18 Pence respectively. The expenditure for the fish and chips showed the highest among the average income group which was exactly 25 Pence while the high and low income groups spent almost less than 20. Almost 20 Pence spent for pizza by the high income group whereas, the average and low income groups only spent around 12 and 8 Pence respectively.
In 1970, both the hamburgers and pizza consumption was less than 100 grammes and remained almost steadily for the next 5 years. Then they reached the peaks around 550 and 275 respectively in 1990. The fish and chips consumption started just over 300 in 1970 and decreased gradually in next 15 years until 200 grammes but in the final 5 years increased slightly around 250.

Fastfood.jpeg
