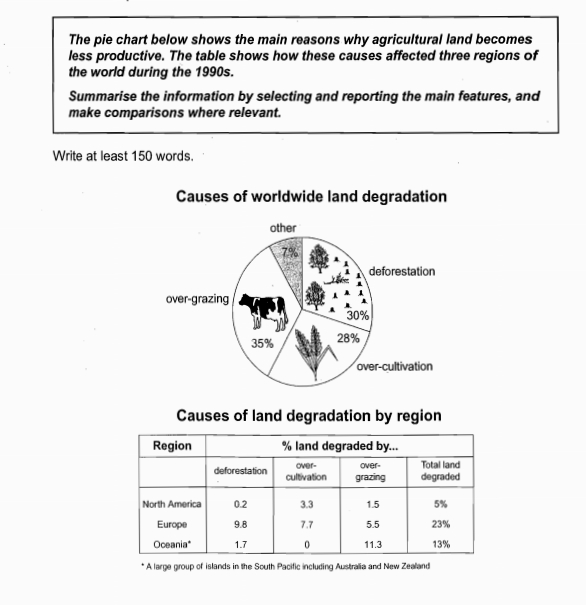
The pie chart provides that there are four reasons why agricultural land has been experienced the worldwide degradation and is measured in percentage. The table highlights the percentage of these causes in the three largest regions in the world during the 1990s.
Clearly, what stands out on the graph is that there are three main causes of degradation fairly in similar patterns: over-grazing, deforestation, and over-cultivation. Interestingly, Europe suffered more farmland degradation than others, where the highest percentage is deforestation activity.
The pie chart shows more than a third of degradation globally is caused by animal grazing. This trend is the highest percentage, where coming second and third are tree clearance and over-cultivation. The deforestation regarding stood at 30% of the cause percentage almost similar with over cultivation which stood at nearly a third. Other causes account for only 7% collectively.
The table indicates that these causes affected different regions differently during 1990s. Europe has experienced a much higher total land of degraded in which 9.8 % of deforestation and 7.7 % of over-cultivation as the biggest ones. Likewise, North America showed over-cultivation is the highest main cause percentage, beside the overall percentage was no more than 5%. In contrast, Oceania group had as much as 11.3 % of degradation due to over-grazing. However, the total of degraded farmland was the second highest proportion after Europe at 13 %.

Gambar_WR_1_PIE_N_TA.jpg
