IELTS task 1: Causes of land degradation
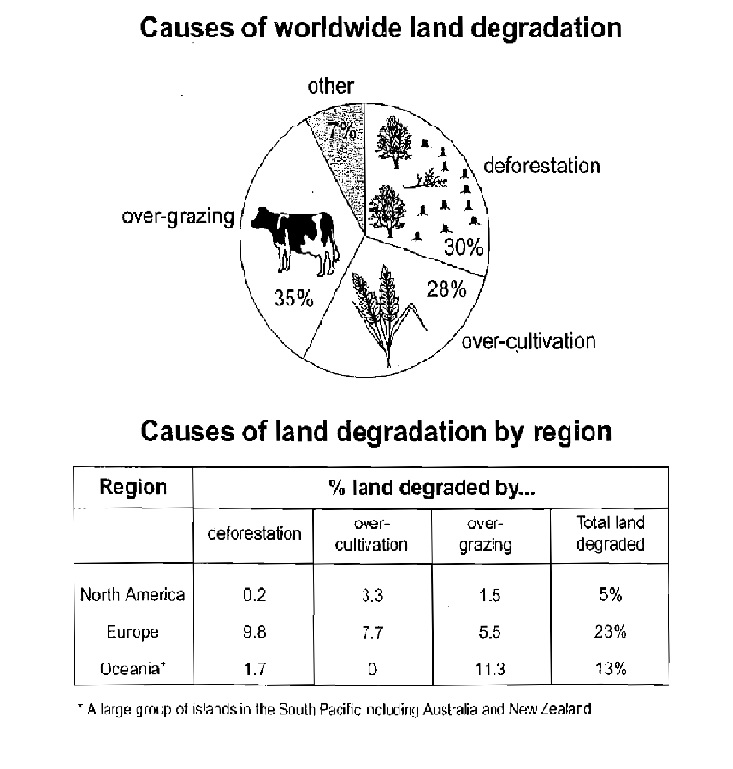
Topic: The pie chart below shows the main reasons why agricultural land becomes less productive. The table shows how these causes affected three regions of the world during the 1990s. Summarise the information by selecting and reporting the main features and make comparisons where relevant.
The pie chart presents the rates of land degraded by different reasons all over the world. Meanwhile, the table illustrates the percentage of land damaged by these factors in three different areas namely North America, Europe and Oceania between 1990 and 1999.
Generally speaking, the rate of land which became less productive caused by the three main reasons varied only slightly. Besides, among the three regions in question, Europe had the highest percentage of land that reduced in quality. At the same time, North America had the lowest figure.
Among the three main causes of land degradation, over-grazing ranked first with 35%. Deforestation came second with 30%. Over-cultivation accounted for 28%. The remaining area of land (7%) was damaged by other reasons.
Europe had 23% of agricultural land became less suitable for that purpose. In which, 9.8% was caused by cutting down of forests and 7.7% was caused by excessive crop planting. Next came Oceania with 13% degraded land, mostly because farmers herded livestock immoderately on them. North America had only 5% of land reduced in quality and the main reason was over-cultivation which accounted for 3.3%.

Untitled.jpg
