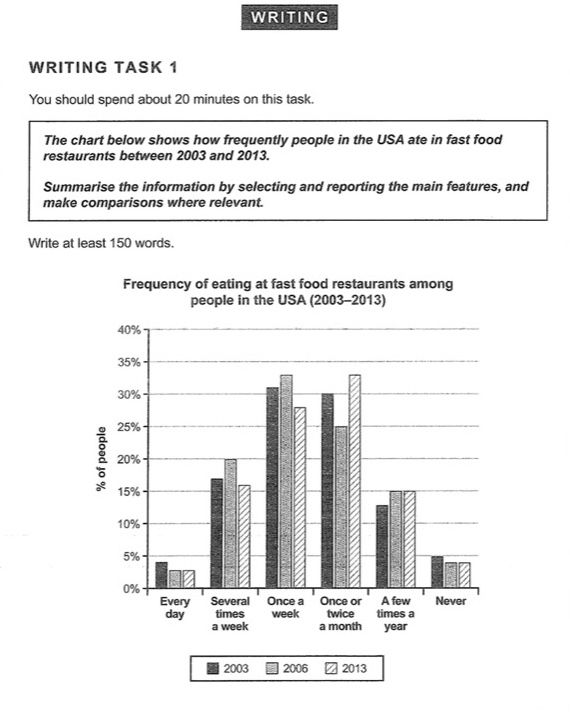
Joey, this is a very weak analytical report based on the chart you were provided. Several presentation problems occurred that resulted in this failed summarized report. These include lack of appropriate data in your presentation, comparison analysis, a proper trending statement, and a clear lack of grammar control when it comes to sentence development. Therefore, this essay will most likely not receive a passing score when it comes to the actual test.
The first paragraph is the prompt paraphrase. For this essay, you need to present:
1. The topic
2. The type of graph - this is not a chart, this is a bar graph
3. Measurements used- percentages
4. Inclusive comparison dates - 2003,2006,2013
5. Trending statement
The above information would have helped you to create an accurate and properly representative paraphrase of the given information.
Next, your paragraphs need to have a uniform number of required sentences in order to gain proper C&C scoring potential. Your sentences that have only 1 or 2 sentences in it do not really convey a clear explanation of the information being presented. The minimum sentence requirement for coherence purposes is 3 with a maximum of 5. 5 sentences shows clarity in the presentation to the utmost extent.
As for your data presentation, you were given the measurements in terms of years and percentages, You need to have used all the percentage references in the yearly presentation and comparison because these are the most important and required information for your report analysis. Leaving out the digits means you are not accurately informing the reader. You need to show the up and down trends in the graph by making references to the percentage measurements per data consideration, per year. So the 3 sentence presentation is:
1. Topic sentence / data consideration
2. Year of analysis
3. percentage of measurement
4. data analysis from your understanding. (Use third person perspective)
Try to write up to 200 words for this type of essay in order to gain the best possible scoring considerations all around. Also, work on your grammar as you have a problem using the correct English words. A specific example of this problem are as follows:
Most people pretend to eat fast food
- There is no pretending here because the information is based on factual collated information from a reputable source. Declare the facts as presented in the graph. Make no assumptions because that is when you make mistakes in your presentation of information.
Camp are to the highest and lowest,
- What is camp referring to?
Differ form other trends
- You mean, "different from other trends" or "Differing from other trends".
- This shows where your problem with lexical resources will cause you to fail this exam.

