Unanswered [4] | Urgent [0]
  

Home / Writing Feedback   % width   Posts: 4


In the chart numbers of waste that were produced by Ireland, Japan, Korea, Poland, Portugal, and US


wuu_u 1 / -  
Oct 28, 2019   #1

IELTS Task 1 : 'waste production' table essay


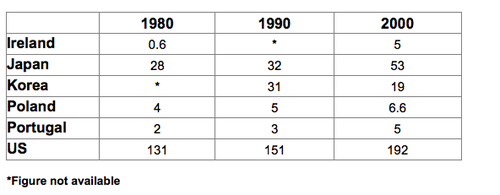
The chart gives the numbers of waste that were produced by Ireland, Japan, Korea, Poland, Portugal, and the US from 1980 to 2000.

Overall, the US produced the greatest amount of waste between 1980 and 2000. It is also clear that Korea was the only country that reduced its number of waste production from 1990 to 2000.

From 1980 to 2000, the amount of waste produced by the US increased from 131 to 192 million tonnes, and the number of wast production in Japan also significantly rose nearly two-times, which is from 28 to 53 million tonnes. Similarly, wast production from Poland and Portugal slightly decreased from 4 to 6.6 million tonnes and from 2 to 5 million tonnes respectively.

During 2 decades, waste production from Ireland increased dramatically to 5 million tonnes, a rise of almost 4.5 million tonnes. By contrast, the number of waste produced by Korea saw a noticeable fall to 19 million tonnes from 1990 to 2000.

  • 317038_1_o.png


ChrisChen 2 / 5  
Oct 29, 2019   #2
*and the number of wast production in ... -> the number of is used for the countable noun. you can choose: the amount of, the quantity of, the volume of, which can be used for the uncountable noun.

*Poland and Portugal slightly decreased from 4 to 6.6 ... -> it should be increased. And you should add a comma before respectively, or you should write: waste production in Poland and Portugal slightly climbed respectively from 4 million tonnes to 6.6 million and from 2 million tonnes to 5 million.

*It should be waste production in ..., not from.
*DO NOT write the particular figures in the last paragraph, because you should write the TREND instead. For example: The US produced the most waste during the whole period, while the other countries just saw a modestly rise in the two decades, except Korea.
vuthaihoa74 2 / 5  
Oct 31, 2019   #3
@wuu_u
To be honest, there are quite a lot of mistakes in your writing.
As for grammar, in addition to what shown in chrischen's comment, i think there is a mistake about tense which is " which is from from 28 to 53 million tonnes". Remember we are talking about the past. Also, i think you don't need to add "which is", just "from 28 to 53 million tonnes" is enough.

As for the ideas, i think adding the information about Korean from 1990 to 2000 is redundant and makes it not fit with the US figure. You should put your first paragraph and the second one into just one paragraph.
Mohsin12236 1 / 2  
Oct 31, 2019   #4
Try to avoid using the same word again nd again e.g the word 'waste'....i mean try to use synonyms....


Home / Writing Feedback / In the chart numbers of waste that were produced by Ireland, Japan, Korea, Poland, Portugal, and US
Need Writing or Editing Help?
Fill out one of these forms:

Graduate Writing / Editing:
GraduateWriter form ◳

Best Essay Service:
CustomPapers form ◳

Excellence in Editing:
Rose Editing ◳

AI-Paper Rewriting:
Robot Rewrite ◳

Academic AI Writer:
Custom AI Writer ◳