***Could you mark this according to 4 criterias like in the real IELTS writing test, namely Task Achievement, Coherence and Cohesion, Lexical Resource, Grammatical Range and Accuracy. Many thanks!
For editing, content, and formatting needs please contact us at essayforum.com@gmail.com. Thank you! EF
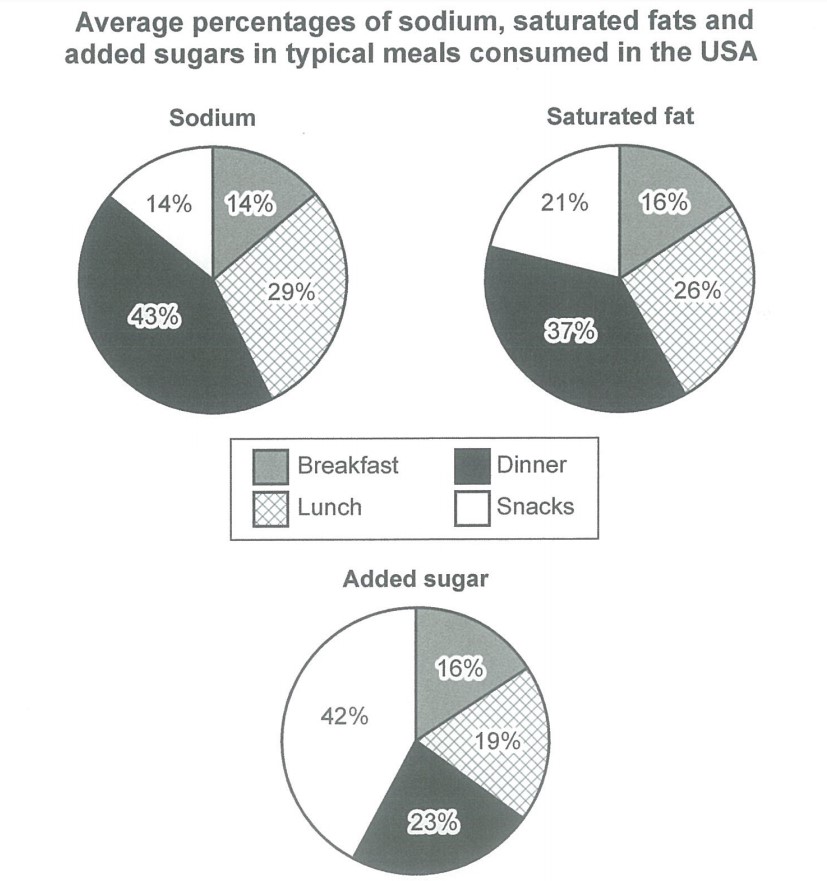
The pie charts detail the average proportions of sodium, saturated fat and added sugar eaten in four types of meals in the USA.
Looking from an overall perspective, it is readily apparent that sodium and saturated fat are consumed most during dinner, while in snacks, people eat added sugar with the highest amount. Furthermore, the closer to the end of the day, the more unhealthy food individuals consume in meals.
Regarding sodium, individuals consume it with the largest amount in dinner, at 43%; the same trend is witnessed in the consumption of saturated fat with 37% at the same time of the day. In contrast, both in breakfast and snacks, citizens have the least proportion of sodium consumed, at 14%. Meanwhile, this figure in lunch approximately doubles those in breakfast and snacks, at 29%. In addition, people take saturated fat with the least amount in breakfast, at 16%. This figure in additional meals and lunch are roughly the same, at 26% and 21%.
In terms of added sugar, over two fifths of this nutrient is taken in in snacks. This figure almost doubles the amount of added sugar consumed in dinner, which accounts for 23%. Lunch and breakfast record the minority of added sugar consumption, with 19% and 16%, respectively.
For editing, content, and formatting needs please contact us at essayforum.com@gmail.com. Thank you! EF
the average percentages in typical meals of three types of nutrients
The pie charts detail the average proportions of sodium, saturated fat and added sugar eaten in four types of meals in the USA.
Looking from an overall perspective, it is readily apparent that sodium and saturated fat are consumed most during dinner, while in snacks, people eat added sugar with the highest amount. Furthermore, the closer to the end of the day, the more unhealthy food individuals consume in meals.
Regarding sodium, individuals consume it with the largest amount in dinner, at 43%; the same trend is witnessed in the consumption of saturated fat with 37% at the same time of the day. In contrast, both in breakfast and snacks, citizens have the least proportion of sodium consumed, at 14%. Meanwhile, this figure in lunch approximately doubles those in breakfast and snacks, at 29%. In addition, people take saturated fat with the least amount in breakfast, at 16%. This figure in additional meals and lunch are roughly the same, at 26% and 21%.
In terms of added sugar, over two fifths of this nutrient is taken in in snacks. This figure almost doubles the amount of added sugar consumed in dinner, which accounts for 23%. Lunch and breakfast record the minority of added sugar consumption, with 19% and 16%, respectively.

03BA5A6507824D38B.jpeg
