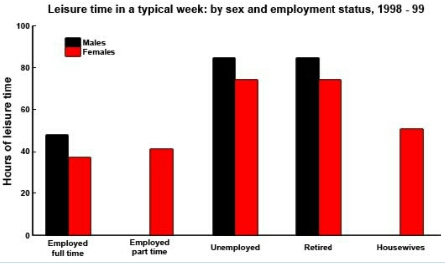
The bar chart below illustrates the number of leisure hours which are entertained by male and female, according to their employment status.
It can be clearly seen from the figures that in unemployment and
retired categories, both sexes used huge amount of leisure hours in a typical week, whereas, full time employees have spent a little time for spare time activities.
Among those full time workers, male had 50 hours of leisure, while female had just fewer approxlmately 10 hours than men workers. In the second category, there were no given figure for male, but female had 40 hours of leisure, only slightly more than women in full time job category.
In the next two unemployment and retired categories, leisure time
showed striking increase for both sexes. Herе too, men enjoyed more leisure time over 80 hours, compared with 70 hours for women, perhaps women spend more time working in the home than men. Finally, housewives enjoyed about 54 hours, but again there were no figure given for househusbands.

PicsArt_139524403857.jpg
