hi mates,,, this is my writing, ,,, I hope you can help me to make it better
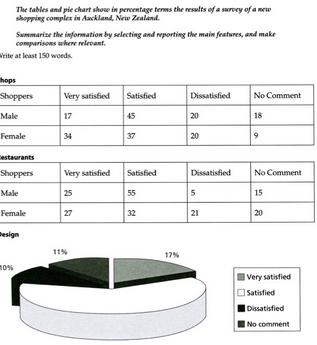
A breakdown of satisfaction level of the customers visiting three different features in a new shopping centre in Auckland, New Zealand is compared by the charts. Overall, it can be seen that the survey reveals that the overall views of customers are positive about the complex. In any case, the highest satisfaction rate is in the design market.
A closer to look he data, it is clear that the number of the female customer who were very happy with the restaurants is considerably more than the people loving shops. The number of purchasers who were satisfied with shops and restaurants is respectively 45 and 55 for men, 37 and 32 for women, while 20 and 25 male, 20 and 21 female have no idea regarding to the facilities.
Apart from previous comparison, based on pie chart, just over three-fifths of customers are bound to the design of the new shopping complex. Meanwhile, 17% of them feel contented, while one tenth of them did not prefer to share their opinions and the rests were not satisfied with it.

Capture.PNG
