Unanswered [4] | Urgent [0]
  

Home / Writing Feedback   % width   Posts: 3


The column chart gives information about the places visited by people living in Australia


Lammm 1 / 1  
Aug 9, 2021   #1

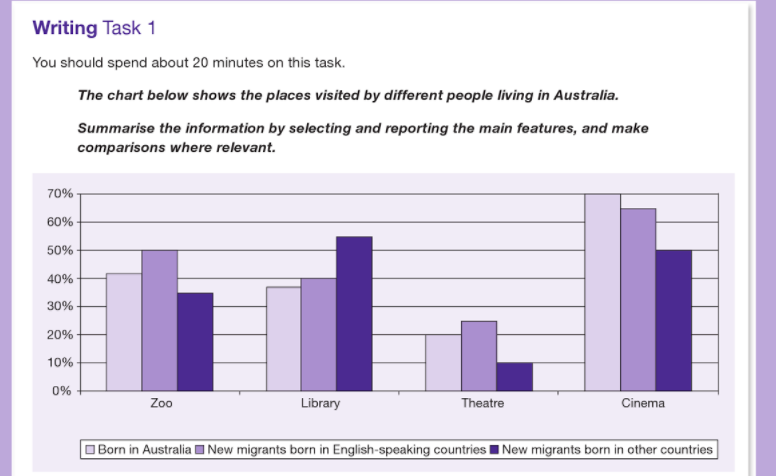
The column chart gives information about the places visited by different people in Australia.


The bar chart depicts data on four different leisure sites dropped in on by 3 distinct groups residing in Australia.
Overall,cinema is the most popular places listed in the chart,while the lowest percentage of people visited the theatre.It is also noticeable that new migrants for whom English is not the first language do not visit almost these places as regularly as the two other groups.

Non-English-speaking migrants spend their time most on library, nearly 55 percent,this figure is followed by recently arrived immigrants from English-speaking countries and native Australians at roughly 40 percent.However ,70 percent non-migrants are cinema-goers compared to 65 percent new-migrants born in Australia and half the migrants where English is not widely spoken.

Zoo is visited by half new migrants born in English-speaking countries ,compared to people born in Australia and new migrants born in other countries,at 41 percent and 35 percent respectively.Turning to the theatre,the rank do not change which the percentage of non-English-speaking migrants is the lowest for all concerned with 10 percent,while the figure for native Australian is 20 percents.A quarter of new migrants born in English-speaking nations are theatre-goers.

  • IMG_20210809_144512..jpg


Holt  Educational Consultant - / 15347  
Aug 10, 2021   #2
The writing approach for this essay is unique in the sense that it should follow a distinct comparative pattern over 4 paragraph. A clear comparison for each group should be completed based on the place visited and the relevant measurement for each of the 3 sectors. That is how the essay becomes clear and easy for the leader to follow and understand. The current presentation is all over the place, lacking a clear paragraph focus/ topic each time. Avoid confusing the presentation by suddenly inserting other places and measurements. That is not the only way to write this report. Use individual comparisons when it will add clarity and coherence to the report.
OP Lammm 1 / 1  
Aug 21, 2021   #3
@Holt
Thank you ! I really appreciate your help.🥰


Home / Writing Feedback / The column chart gives information about the places visited by people living in Australia
Do You Need
Academic Writing
or Editing Help?
Need professional help with your assignments? Fill out one of these forms:

Graduate Writing / Editing:
GraduateWriter form ◳

Best Essay Service:
CustomPapers form ◳

Excellence in Editing:
Rose Editing ◳

AI-Paper Rewriting:
Robot Rewrite ◳