Question :
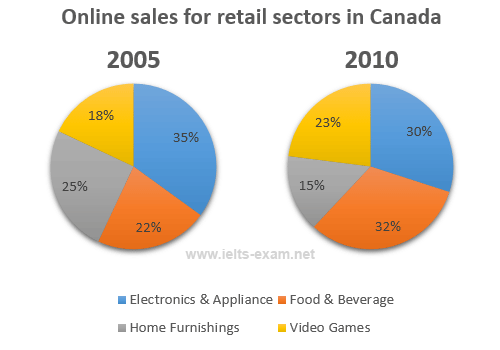
The two pie charts below show the online shopping sales for retail sectors in Canada in 2005 and 2010.
The pie charts illustrate the comparison of four different e-commerce retail sectors in Canada, during a 5 year period time from 2005 to 2010. Overall, it is noticeable while meal and drink and video games saw upward trend, others experienced a downward trend.
To begin with, in 2005 the highest proportion was electronics and tools, while diet and drink saw the lowest percentage. However, in 2010 food and beverage had decreased 5% in different year , it was 35% (2005) to 30% (2010). While, households was turned out dramatically from 25% in 2005 and became 15% during a 5 year.
In the other side, food and beverage had increased significantly from 22% (2005) to 32% in 2010. It was followed by video games, in 2005 it was 18% and rised to 23% in 2010. That video game sectors saw a less dramatically change, it just decreased one out of twenty.

http://www.ielts-exam.net/academic_writing_samples_task_1/828/
