TASK 1.
Electricity generation by source in Germany .
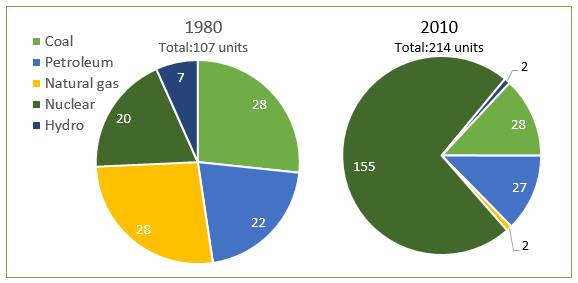
A comparison of electricity generation units by source in Germany in 1980 and 2010 is highlighted in the pie chart. Overall, a significant alteration ocurred in power plants utilisation during the span, while its total rose dramatically as well.
Nuclear and natural gas were the most detected-change amidst the other electricity generations. Stood at only 20 units nuclear in 1980 and reached 155 in the last year. While the natural gas dropped by fourteenfold from 28 units.
Subsequently, there were the modest variation happened to the three electricity generation sources. Petrolium and hydro generation used 22 and 7 units respectively in 1980. This rate rose by 5 units in petroleum, and hydro plant usage felt from 7 to 2 units. Meanwhile, the number for coal remained stable at 28 units. Astonoshingly, the figures for those power plant increased doubled over the period; started 107 units in 1980 became 214 units in the last observation year.

7_april__german.jpg
