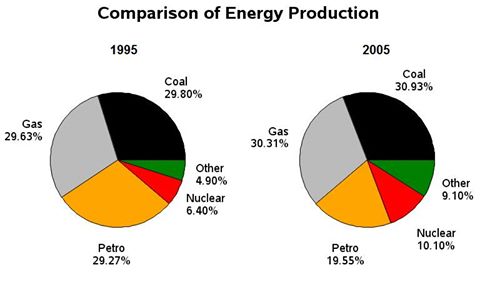
The pie charts compare of five mining sector categories in France during year 1995 and 2005. Over all, it can be seen along in one decade Coal and Gas industry have big proportion then following Gasoline. Whereas, Nuclear and other product has increased along ten years. In summary, fuel production has increased in early year and fell down over 1995. Although, Coal has flat but reverse Nuclear and Other production increase a decade.
In time the comparison product mining and gas industry shows variety in number and trend. The pie graph shows coal mining increased gradually in production to around one percent at 1995 to 2005. Yet, Liquid energy only increase at number as much as Coal production is around on in twenty. Interestingly, petrol along ten decade decreased dramatically down twice time amount at 29 to 19 percent. On the other hand, nuclear energy gradually increase in number about one in fifty. While other production increase significantly of number approximately five percent.
In time the comparison product mining and gas industry shows variety in number and trend. The pie graph shows coal mining increased gradually in production to around one percent at 1995 to 2005. Yet, Liquid energy only increase at number as much as Coal production is around on in twenty. Interestingly, petrol along ten decade decreased dramatically down twice time amount at 29 to 19 percent. On the other hand, nuclear energy gradually increase in number about one in fifty. While other production increase significantly of number approximately five percent.

writing_task_3__Pie.jpg
