Writing task 1 - Global water use by sector
Q: The graph and table below give information about water use worldwide and water consumption in two different countries. Summarize the information by selecting and reporting the main feature and make comparisons where relevant.
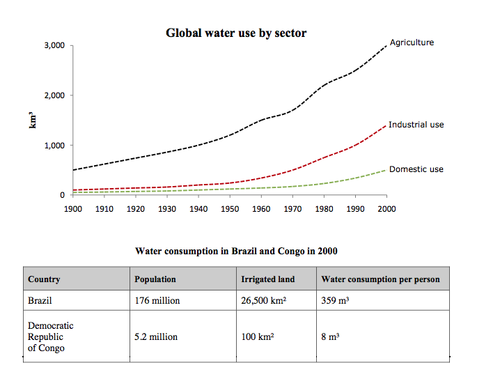
The graph reveals differences in the universal trend in using water for 3 distinct purposes over a period of one hundred years, while the table shows different water consumption of Brazil and Congo in the year 2000.
It is obvious that the global use of water in all three sector grew steadily, especially in agriculture. Additionally, in 2000, Brazil had a greater size of population, irrigated area and individual water consumption tha Congo.
As can be seen from the graph, in the beginning year 1900, water was used most by the world for agricultural activities with approximately 5000 km3, whereas in the other sectors, including industry and domesticity, the figures were very comparatively low. Their usage increased gradually and became more dramatically since 1950. At the end of the period, in 2000, the world consumed up to 3000 km3 water for farming tasks, which was over twice as much as in industrial use. Household activities accounted for the lowest volume of water used, at about 4000 km3.
In addition, tha data given shows Brazil utilized much water than Democratic Republic of Congo. There was a population of 176 million in Brazil, compared to only 5.2 million in Congo in 2000. Besides, this country had up to 26500 km2 of farming land, which was 256 times greater than Congo. Also, their personal use of water was noticeably higher than Congo as it reached up to 359 m3, while in the other country only 8 m3 was consumed by every individual.
If possible, please give me an estimated band score. Thanks so much.
Click to see the image more clearly.

6a0120a5bb05d8970c01.png
