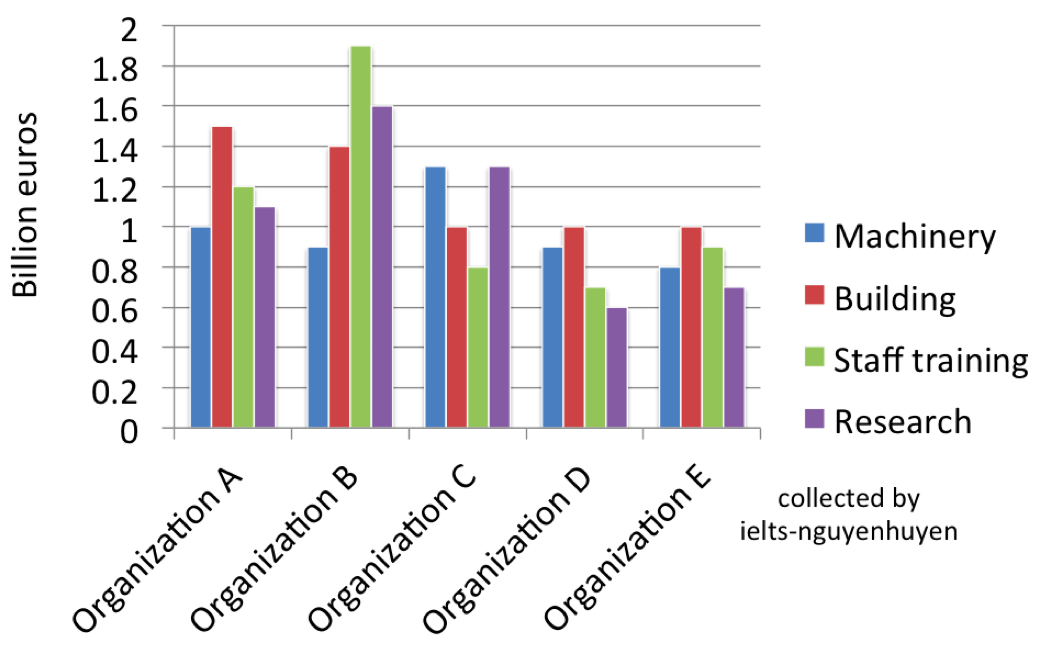
billions of Euros for different sectors - comparison
The bar chart illustrates the different ways of five companies invest in machinery, building, staff training, and research.
Overall, organization B has the largest investment while the amount of money two companies D and E fund for the categories are less than others. Besides, the organization C has the most different investment pattern in all.
Looking at the chart in more detail, most categories are allocated above $1 billion in organization A and B. The largest investment of organization A goes to building, which is around $1.5 billion; followed by $1.2 billion is allocated for staff training. However, organization B spend over $1.8 billion on employee training, which is the largest investment of all categories. $1.6 billion is the amount of money investing research which is much higher than that of organization A ($1.2 billion). Besides, machinery is allocated the least money in both organizations.
Organizations D and E have the same pattern in investment with the same amount at money allocating for building ($1 billion) and study is the least invested category. However, in organization C, research and machinery are both invested at $1.2 billion while the least invested categories are building and staff training ($1 billion and $0.8 billion respectively).

dethiieltswriting.png
