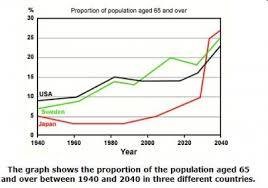
A breakdown of the information about the proportion of elderly people in three different developed countries for a 100-year period, started in 1940 is described in the given line graph. Overall, it can be seen that the number of elderly inhabitant in those countries has the similar upward trend and it is predicted to increase with the same pattern in the future.
To begin, by 1940, USA and Sweden had higher proportion of older people living there at around 10% and 7% respectively and grew gradually in the next following decades. In contrast, Japanese elderly inhabitant had remain below one a fifth and kept unchanged for several years.
In 1990, the aging people in two countries experienced a slight drop while Japan started to show an increase in elder inhabitant. Furthermore, in 2040, it is forecasted that Japan's elderly population will grow significantly and hit a peak nearly five times higher than the first time of the period. This projection places Japan in the highest position in the elderly citizen ratio and is followed by Sweden and USA.

task_1__02.jpg
