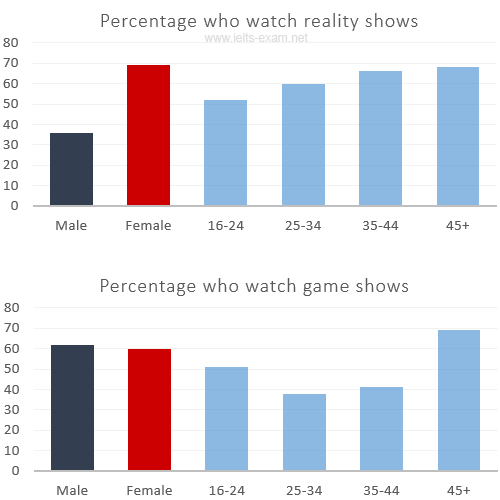
Two charts provide a breakdown information of TV programs watched by two genders and four different age groups, which are female, male and the ages are, 16 to 24, 25 to 34 and 45 and older. This measured in percentage. If analyzed, female takes the first place, regarding the reality shows, while 45 and older wins the first place of game shows.
Female peaks at 70 percent, if the story is about the reality shows, this value is huger than the male's one for over 30 percent. Group of ages has a different story, at first, from 16 to 24 has approximately 50 percent. The older the group the bigger the percent. The consecutive gap between all ages is about 3 percent. As a result, 45 and older reaches close to 70 percent.
When it comes to the game shows, both female and male record as roughly 60 percent. Two groups, which are 16 to 24 and 45 and older have the highest percent of viewers, as for group of ages. 16 to 24 has 50 percent, in the meantime, 45 plus has 70 percent. Alongside them, 25 to 34 and 35 to 44 share the almost identical story, with their approximately 40 percent respectively.

IELTS_Writing_Task_1.png
