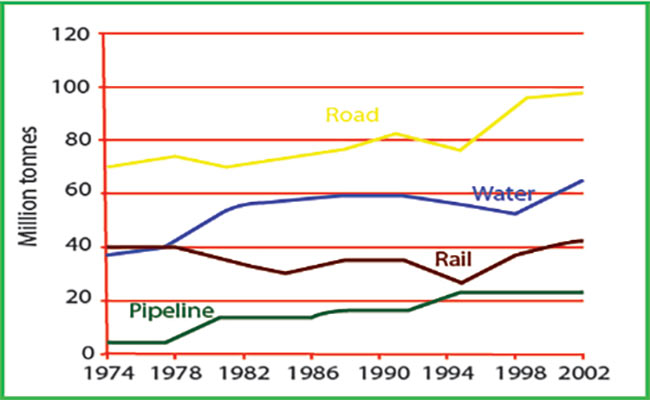
The graph reveals information about the figures of commodities transported in the UK from 1974 until 2002 by using four kinds of transportation. Those transportations were the road, water, rail and pipeline. Overall, most of the goods transported via those transportation systems presented the upward trends which increased gradually for 28 years.
Looking at the details, the highest amount of commodities transported was shown by land transportation which was around 70 million tonnes in 1974 to approximately 100 million tonnes in 2002. As a result, it can be stated as a vast improvement among other mentioned transportation. In the second place, there was water transportation which gained about 20 million tonnes of goods in the observed years.
Furthermore, the fluctuation trend came from rail transportation. In 1974, the usage of the train for transporting goods was quite similar with water transportation about 40 million tonnes, however, during the following years, it gave a tiny increase. Inconstantly, the pipeline had been the lowest amount of supplies in 1974 which was around 10 million tonnes and just steadily inclined a bit of 20 million tonnes in 2002.
(181 WORDS)

Goods_transported_in.jpg
