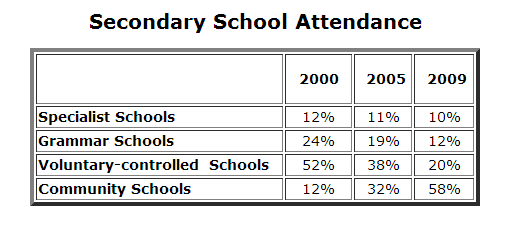
The table reveals four different subjects which are attended by secondary school students from 2000 to 2009 and is measured in percentage. What stands out from the chart shows that while the community schools experienced as the lowest, this trend increased over the year.
In 2000, the secondary school student who attended Voluntary-controlled schools was considerable higher than the other subjects. The percentage witnessed by 52 per cent. Compared to this subject, community schools and specialist schools were lower, stood at solely 12 per cent. Over the following nine years, this attendant decreased dramatically to 20 per cent in 2009. Following this, there was a slight fall in the percentage of specialist school by two per cent.
Interestingly, while the student entering the class in community school was not as much as the others, this trend rose over the year. In 2009, the figure peaked at 58 per cent. This witnessed the highest than the other attendances. On the other hand, student fascinated in grammar schools had dropped to twelve per cent in the same period.

ES8.png
