Topic:
The line graph compare four modes of transport in terms of the amounts of goods they conveyed in the UK from 1974 to 2002
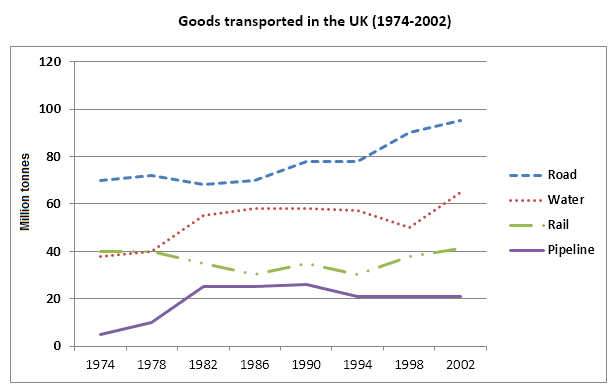
At first glance, it is noticeable that the quantities of goods transported by nearly all means of transport witnessed an increase over the time frame with the exception of rail. Also, road registered the highest amount of goods throughout the period.
In 1974, about 70 million tonnes of goods were transported by road, compared to 39 million tonnes carried via waterways. While the trend for road was upward with some fluctuations and a mild growth to 95% in 2002, the good transport by water was consistently below 60 million tonnes until 1998, before rising to around 65 million tonnes in the final year.
In the meantime, the initial quantity of goods conveyed through pipeline were 5 million tonnes. Over the following 8 years, there was an upsurge in its figure to 25%, followed a period of stability and then a downfall, falling back to 20 million tonnes. By contrast, the good conveyance via railways proved quite erratic, with its figure varying between 30 and 40 million tonnes over the timescale.
The graph below shows the quantities of goods transported in the UK between 1974 and 2002 by four different modes of transport.
The line graph compare four modes of transport in terms of the amounts of goods they conveyed in the UK from 1974 to 2002
At first glance, it is noticeable that the quantities of goods transported by nearly all means of transport witnessed an increase over the time frame with the exception of rail. Also, road registered the highest amount of goods throughout the period.
In 1974, about 70 million tonnes of goods were transported by road, compared to 39 million tonnes carried via waterways. While the trend for road was upward with some fluctuations and a mild growth to 95% in 2002, the good transport by water was consistently below 60 million tonnes until 1998, before rising to around 65 million tonnes in the final year.
In the meantime, the initial quantity of goods conveyed through pipeline were 5 million tonnes. Over the following 8 years, there was an upsurge in its figure to 25%, followed a period of stability and then a downfall, falling back to 20 million tonnes. By contrast, the good conveyance via railways proved quite erratic, with its figure varying between 30 and 40 million tonnes over the timescale.

IELTS_Writing_Task_1.png
