oil consumption in different world lands
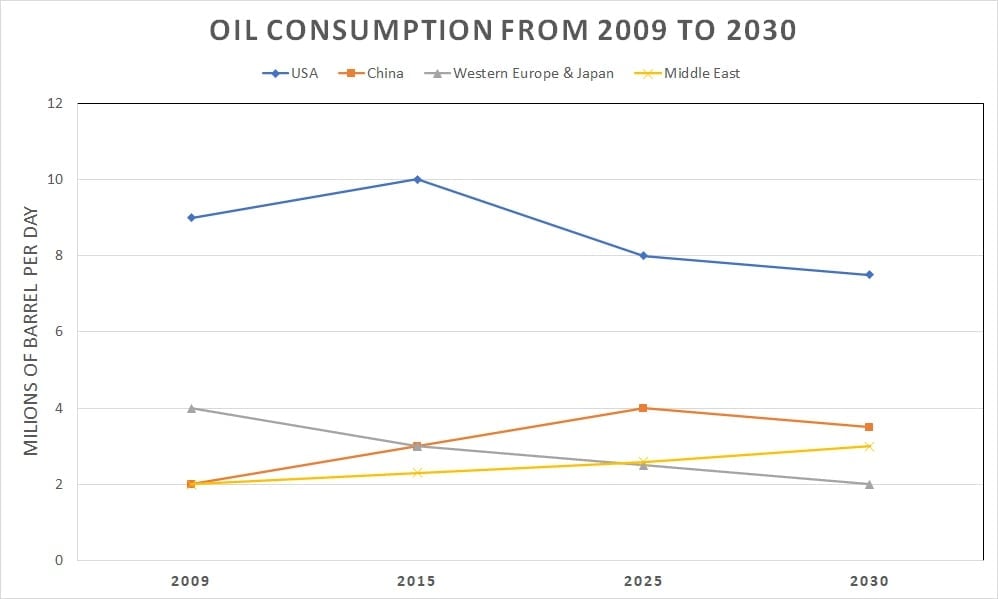
The graph below shows information about the total oil consumption of four major consumers from 2009 to 2030.
ANSWER:
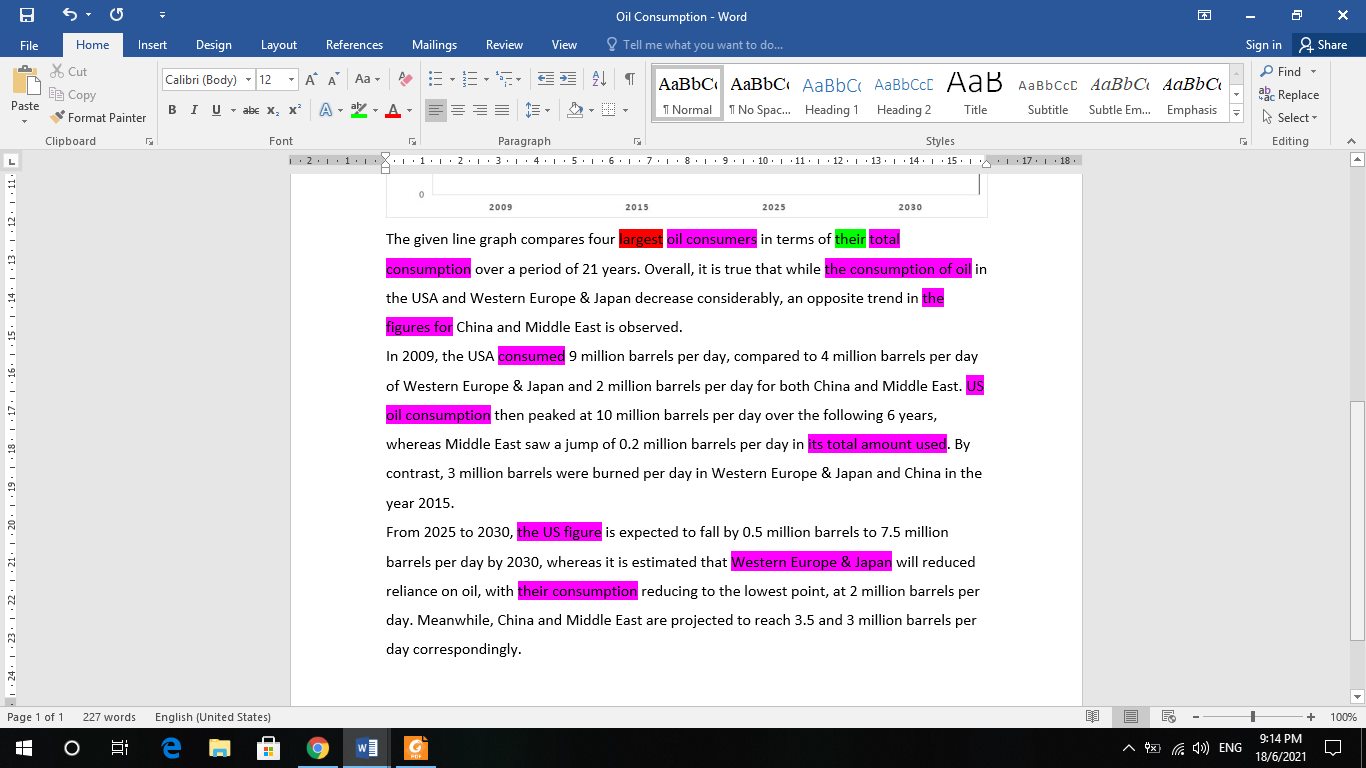
The give line graph compares the four different regions in term of the amount of oil consumed between 2009 and 2030.
Overall, from 2015, oil consumption in the US and also in Western Europe and Japan is forecast to decline, in contrast to the expected increase in China and Middle East. It is also noticeable that the US was by far the biggest consumer of oil from 2009 until present and it predicted to remain the biggest consumer until 2030.
Standing at approximately 9 million barrels daily the US ranked first in term of the amount of oil used in 2009, followed by that of Western Europe and Japan with nearly 4 million. Meanwhile, the figures for China and Middle East were remarkably lower, just about 2 million per day.
In 2015, even though the US's oil consumption reached a peak of around 10 million barrels, this figure is expected to decrease significantly to just over 8 million barrels in 2030. Beside, before falling to about 3.5 million in 2030, the number of oil barrels consumed in China is anticipated to rise to 4 million in 2025 which make this country become the second biggest oil consumer. In the Middle East, a steady rise in the figures is predicted to reach a peak of 3 million in 2030 while consumption is expected to decrease to 2 million barrels in Western Europe and Japan.

wrtingtask1ngay172.jpg
199287409_1793129244.jpg
