The graphs below provide information on global population figures and figures for urban populations in different world regions. Summarise the information by selecting and reporting the main features, and make comparisons where relevant.
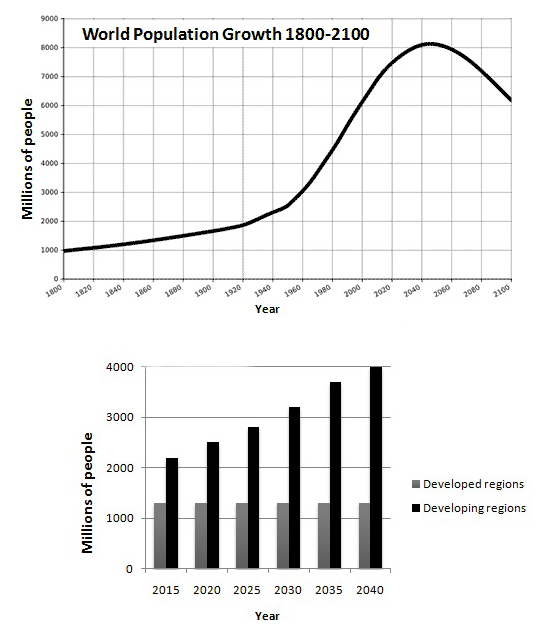
The first graph illustrates the trend of wold society growth from 1800 to 2100, while the second chart depicts a prediction in the future over a 25-year period.
In general, it can be seen from the graph that the number of global population decreased in the last period (2100), while base on a forcast the majority of population will occur in the non-globalise countries from 2015 to 2040.
A more detailed look at the graph indicates that the number of population started from 1 billion of inhabitants in the 1800 and countinued a slow increase from under 1-to-2.5 billion of population between 1800 and 1950. Moreover, the growth rate rose shaply from the end of 1950 to early 2400 and achieved a peak at 8.2 billion by 2050. The global population suddenly began to decline a slightly from 2050 to 2100 and sat at 6.2 by 2100.
Turning to the chat presents the expectation that almost all populations growth from 2015 to 2040 will occur in cities of non-globalise countries and the number of citizen was a dramatic increase from 2015 onwards. In the globalise regions, however, over 1 billion populations over the next 20-year had not levelling off until the end of the 2040.
Overall, the graphs show that the majority of global population increase will not live in the particular world, but will be greater in some areas than others.

IELTS_tia.png
