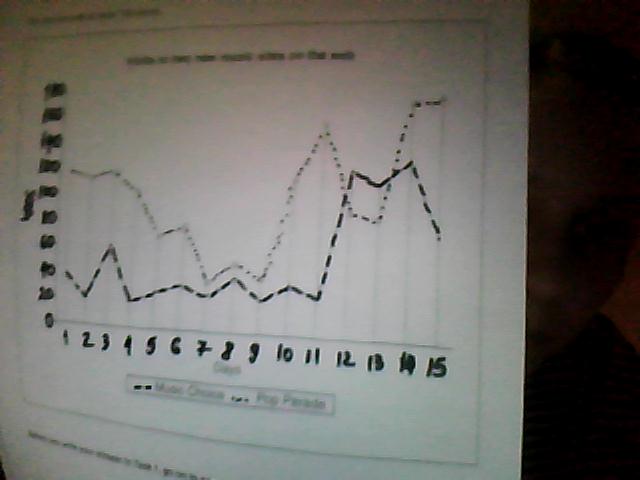
The graph presents the number of visits to two new music sites on the internet, during the period of 15 days.
One thing that clearly standds out is that on the first eleven days, the number of visits to Music Choice fluctuated between 20,000 and 40,000 except for the third day it it reached a peak of 60,000 visits.On the other hand, Pop Parade was highly above Music Choice with 120,000 hits on Day 1.Surprisingly Pop Parade reached the lowest point with 40,000 visits on Day 7.
Between days 11 and 15, the visits to Music Choice increased, reaching the highest point of 120,000 visits on Day 14.On Day 11, Pop Parade reached a point of almost 160,000 visits, whereas in days 12 and 13 the number of visits declined under 100,000.After that the number of visits to Pop Parade increased up to almost 180,000 on Day 15 while Music Choice showed a decline to around 70,000.

IMG0137.jpg
