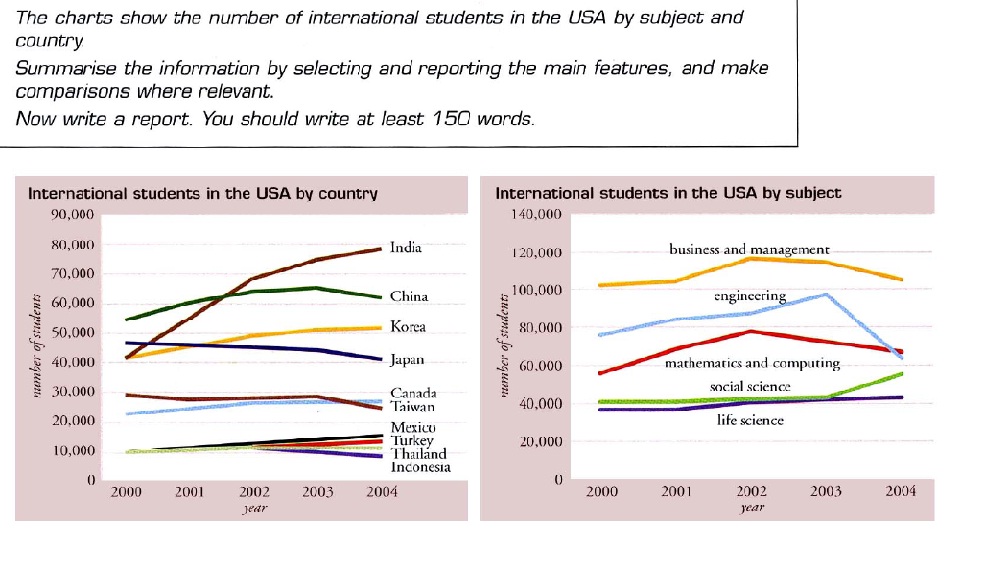
The charts show the number of international students in the USA by subject and country.
Summarise th information by selecting and reporting the main features, and make comparisons where relevant.
Now write a report. You should write at least 150 words.
The charts was attached.
The first graphic gives the quantity of abroad student in the USA between 2000 and 2004 years. Second chart show the number of student diving them by subject.
2000 the most students came from China but in 2004 China gave this position to India. In 2000 number of students came from India was 40 000 line jump to 79000. Negative position between these years show Japan, Taiwan, Indonesia .Students from Turkey, Mexico and Canada increase a little.
On the line chart we can noticeable see that the most of international students study in "business and management " .There is a little different changes from 2000 to 2004 in a number of student who choose business and management. In engineering line shows decrease to 2004. There is growing the number of students who studying in social science. The least chosen subject was life center and this position stays the same for 4 years. Mathematic and computing in 2002 year shows rising trend but to 2004 declines.
Thanks

chartt.jpg
