Unanswered [1] | Urgent [0]
  

Home / Writing Feedback   % width   Posts: 2


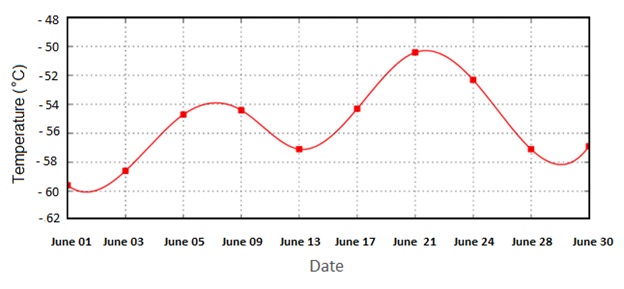
IELTS Writing Task 1 The graph below shows the average temperature in Antarctica in June 2015.


RomanKoch 10 / 22  
May 4, 2020   #1

temperature changes in Antarctica


The graph below shows the average temperature in Antarctica in June 2015.
Summarise the information by selecting and reporting the main features and make comparisons where relevant.

The chart provides information about the temperature changes in Antarctica during June of 2015.

Overall, the temperatures were considerably fluctuating throughout the month with every low point followed by a peak.

As the data illustrates, the coldest day recorded was the first day of the month with almost minus 60 degrees Celsius on the thermometer. The weather started to improve during the next several days and entered the first, albeit smaller, peak of June reaching minus 54 degrees between June 5 and June 9. After falling down by three degrees by June 13, the situation significantly improved once again and Antarctica witnessed the second period of relative warmth. This time it was the warmest period when the temperature climbed to nearly -50 degrees C on June 21. During the rest of the month, the continent experienced a prolonged downward trend with the coldest days in the end of June when the measurements indicated a total drop by 8 degrees from the previous highest record.

  • test.jpg


Holt  Educational Consultant - / 15384  
May 5, 2020   #2
While you did write 162 words, your essay does not follow the presentation requirements in terms of paragraph presentations. You need to present 3-4 paragraphs for this essay. Each paragraph should have 3-5 sentences that indicate the data provided. You decided to compress everything into a single paragraph presentation, which will negatively impact your final score. Meeting the word count is useless if you did not format the presentation properly. You will meet with point deductions in this case, which could prevent you from achieving a passing score.

The summary overview does not present the complete summary information. You neglected to present the type of measurement, the range of temperatures considered, and the inclusive dates of the month of June. You cannot simply say, for the month of June. You need to give the start and end date of the measurement because it is indicated in the chart. The trending statement should have indicated the highest and lowest measurement points to show the fluctuation trend from the chart. The summary overview should be able to inform the reader of the complete information even without having to read the whole report. Hence, the data accuracy is of vital importance in the summary overview.

Unless you know how to use the special character for Celsius in the presentation, it will be better for you to spell it out every time you present the measurement. That way you keep the reader reminded of the measurement type used. Simply saying C might end up confusing the reader who may forget what the letter stands for.

Format the essay into proper paragraphs to make it easier to read and also, allow the examiner a better opportunity to assess your ability to clearly explain the data, per paragraph. This will help increase your overall scoring considerations.


Home / Writing Feedback / IELTS Writing Task 1 The graph below shows the average temperature in Antarctica in June 2015.
Do You Need
Academic Writing
or Editing Help?
Fill out one of these forms:

Graduate Writing / Editing:
GraduateWriter form ◳

Best Essay Service:
CustomPapers form ◳

Excellence in Editing:
Rose Editing ◳

AI-Paper Rewriting:
Robot Rewrite ◳

Academic AI Writer:
Custom AI Writer ◳