TASK 1: Happiness Level of Married and Single People
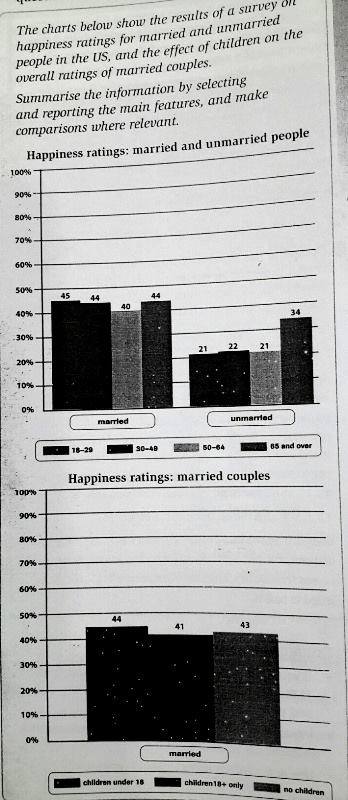
A breakdown of the levels of happiness for couples and single people based on their age and in particular, the blissfulness of who have married according to their children, is illustrated in the bar charts. Both of which is measured in the percentage. Overall, it is noticeable that the happiness of people with married status is clearly greater than another in the all age group. In any case, the factors of gratefulness, which are the number and the age of children, have similar proportion.
To begin, the rating of happiness for married couples almost has the same percentage though people aged 18 to 29 are slightly greater by 1% than the group aged 30 until 49 and residents aged between the ages of 50 and 64. As for another group of age, it accounts for exactly 40%. On the other hand, although unmarried people in over 60 group of age are happier than the rest groups, it is represented just 34%. For other age groups, it is counted around one-fifth of the proportion.
Turning to the second bar chart, it shows the percentage of happiness of people in marriage status reaches the highest percentage when they have children under 18 years of age, at 44%. Meanwhile, the couples who do not have babies are less satisfied with the difference of 1% in the percentage. The satisfaction of family who only have grown-up children is presented at 41%. At first glance, the happiness of couples who have been married accounts virtually the same percentage in all group of age while another status is dominated in one age group.

267799_1_o.jpg
