Unanswered [3] | Urgent [0]
  

Home / Writing Feedback   % width   Posts: 3


IELTS WRITING TASK 1: HELP ME TO CHECK MY PREPARATION FOR MY UPCOMING EXAM - export values


thanhyen2003 1 / 2  
Mar 8, 2022   #1

the value of fuel and other goods exported


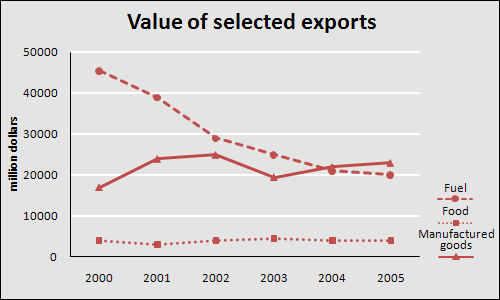
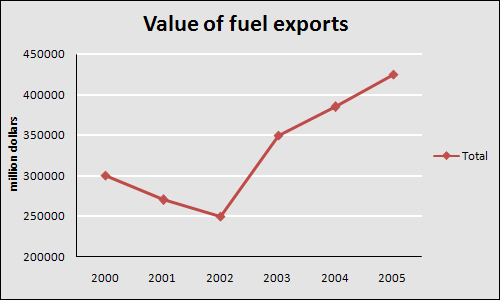
The graph below shows the total value of exports and the value of fuel, food and manufactured goods exported by one country from 2000 to 2005.
Summarise the information by selecting and reporting the main features, and make comparisons where relevant.


The charts demonstrate the value of products exported, especially in fuel, food, manufactured goods of one country during the 5-year period from 2000 to 2005.
The price of goods exported from this country increased in general but particularly, these figures decreased by 50000 dollars between the year 2000 and 2002 and began to rise sharply 4 years later which nearly tripled in the final year than that in the initial year.

The value of export was not the same between different kinds of goods within one country. It is clear to see from the charts that there were three trends of exported value corresponding to fuel, food and manufactured goods. Firstly, food had the least contribution in the total value export which remained stable at 5000 dollars level during 6 years. Secondly, the profit earned from selling fuel to others of this country made up the highest figure in 2000 but these declined gradually through 2000 to 2005. For manufactured goods, this data fluctuated between 2000 and 2005 from nearly 16000 dollars to approximately 25000 dollars.

PLEASE HELP ME. THANK YOU VERY MUCH

  • 1.gif

  • 2.gif


Holt  Educational Consultant - / 15393  
Mar 9, 2022   #2
Charts are the general reference to the measurements provided in an image. Such a reference is considered vague and not very useful in presentations where accurate referencing is a must. The correct image description is needed to help the reader understand the type of measurements used and, allow them to plot the same on their own if they have to. Therefore, the report must be specific about the type of chart used. In this case, the reference should be 2 line charts. The plural of the word is used to indicate 2 seperate line chart functions. The number of charts should be used to clearly seperate the information contained in each chart. A collective summary such as the one presented here lacks clarity and cannot help in the reconstruction of the said image.

There are 2 images presented. Whenever there is more than 1 image present, the writer must use the 4 paragraph format in order to create a clear separation in information references. His spacing in the page must be clear. The Enter or Return button must be used to clearly show the paragraph separation in reference to information presentation. That is not very clear in this current format and as such, makes it appear like there are 2 paragraphs that were incorrectly formatted. The writer has an option for the summary overview:

- Combine the trending reference with the summary to create a single paragraph of up to 5 sentences.
- Create a separate trending reference of at least 3 sentences to meet the minimum paragraph requirement.

Either way is acceptable but, the first representation normally gets the higher score.


Home / Writing Feedback / IELTS WRITING TASK 1: HELP ME TO CHECK MY PREPARATION FOR MY UPCOMING EXAM - export values
Need Writing or Editing Help?
Fill out one of these forms:

Graduate Writing / Editing:
GraduateWriter form ◳

Best Essay Service:
CustomPapers form ◳

Excellence in Editing:
Rose Editing ◳

AI-Paper Rewriting:
Robot Rewrite ◳

Academic AI Writer:
Custom AI Writer ◳