The chart below shows the amount of money per week spent on fast foods in Britain. The graph shows the trends in consumption of fast foods. Write a report for a university lecturer describing the information shown below.
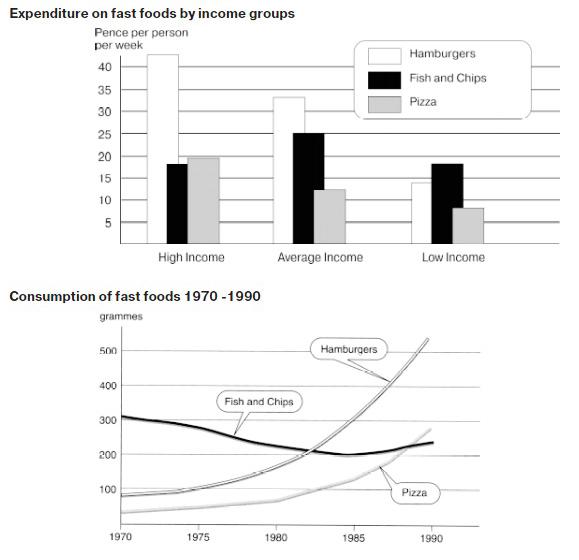
The bar chart shows the changes in weekly spending by Britons on three types of the fast food: Hamburger, Fish & Chips and Pizza, while the line graph presents the fast-food consumption from 1970 to 1990.
Turning to the data, high-income and average-income people are more likely to consume Hamburgers, presented over forty-two and thirty-two pence per week. However, Fish & Chips come second in all options for average-income people, while high-income people tend to choose Pizza for the second alternative fast food. In the case of low-income people, the expenditure on Pizza as favorable food is 8%.
As seen, Hamburgers and Pizza rose steadily between 1970 and 1980, while Fish & Chips declined slightly from 300 to nearly 200 grammes. While, Hamburger had again risen to the same figure as Fish & Chips in 1970, Pizza had approximately 100 grammes. From 1985 onwards, both Hamburgers and Fish & Chips rose steadily over twice as high as Pizza recording 270 grammes. The figure of Fish & Chips was just smaller than Pizza, which of Fish & Chips had approximately 230 grammes in 1990.
Clearly, there are 3 types of fast food that Britons are keen on eating in the early 21th century. The last two types of fast food were a notable rise, but Fish & Chips were the reserve over 20 years.

fast_food.jpg
