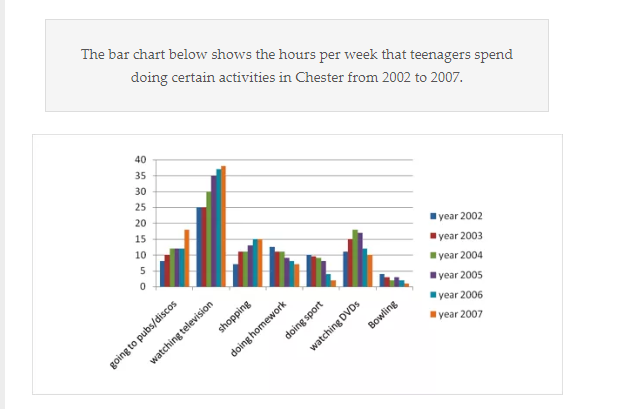
popular activities in Chester from 2002 to 2007
The bar chart illustrates the amount of time that adolescents dedicated for particular activities weekly in Chester from 2002 to 2007. Units are measured in hours.
Overall, it is noticeable that the youngsters spent most hours for watching TV over the years. Meanwhile, time consuming for bowling consistently stood at the lowest. In addition, these activities time such as going to pubs and shopping had climbing trends whereas doing homework, sport, watching DVDs kept decreasing throughout the period.
In 2002, time for watching television already reached the highest rate compared to other activities which accounted for 25 hours per week. This statistic still remained the same in 2003 then rose gradually to a peak of around 37 hours in 2007. In contrast, 2002 saw just under 5 hours in bowling each week. During the timeframe, there were fluctuations on the consuming time until it dropped to nearly one hour weekly in 2007.
Regarding to other leisure activities like going to pubs and shopping ,the figures showed significant leaps, especially discos time rocketing to around ten more hours from 2002 to 2007. The remaining activities fell gradually excepting for watching DVDs which recorded a rise of about 17 hours in 2004, however, 2007 witnessed a plunge of exactly 10 hours,nearly the same with the start of the period.

barchartChester.PN.png
