An average British family and number of cars
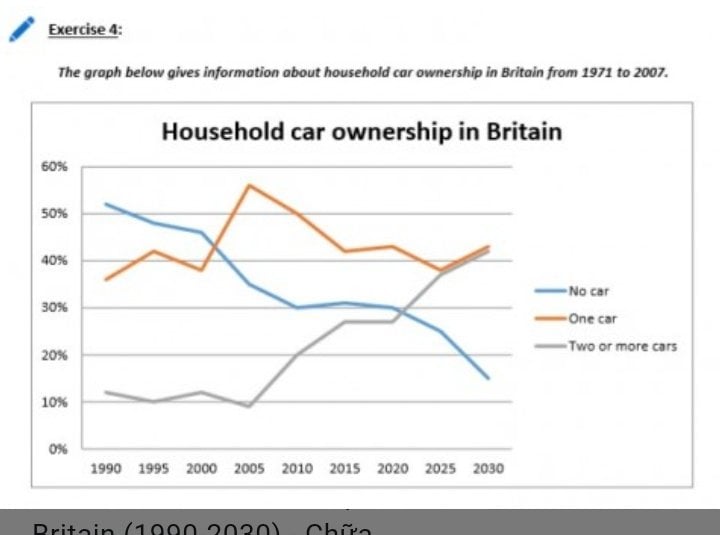
The line graph illustrious the proportion of car possessed by British household over the period from 1971 to 2007.
It is clear that the figure on all three sides varied consistently. The number of families owned one car and two or more cars were prefer. Meanwhile, the opposite was true for that of no car.
At the beginning of the period, majority of residents tended to favourite other transports without car which stood at over 50%. In 2005, the figures for one car ownership peaked at around 55%, while that of no car experienced a dramatical decrease to 35%.At the same time, the percentage of two or more cars fluctuated steadily about 15%.
In 2015, there was a significant deline of over 23% in the proportion one car. The opposite parttern can be seen two or more car ownership. From 2015 onwards, the trending of not using using car of households went down considerably at stood at 15%, compared to that of one car and two or more cars possession were close behind at roughly 40% at the end of the period.

192306751_2642363987.jpg
