Unanswered [4] | Urgent [0]
  

Home / Writing Feedback   % width   Posts: 4


IETLS Task 1 - The graph includes the proportion of households owned and rented in England and Wales


tom726 1 / -  
Jul 29, 2020   #1

Households owning and renting accommodation in two countries


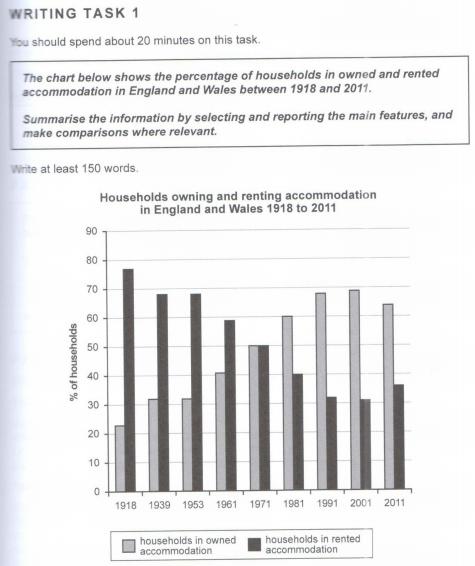
The graph below includes the proportion of households owned and rented in two countries from 1918 to 2011.

The households owned are in a trend of rising while the households in rented are in a falling trend. Their peak and lowest point are in the opposite position.

In 1918, the households owned is about 20% and the households in rented are about 80% respectively. But in 1971, both of them increase and decrease in a similar percentage, lead to an equal level of 50%. In 2011, they kept their trend as a result of 65% and 35%.

Regarding the peak and the lowest point, in terms of owned, its peak is in 2001 which is about 70% while its lowest point is in 1918 which is slightly above 20%. On the other hand, households in rented reached its peak in 1918 with 78% and facing its lowest point in 2001 with slightly over 30%.

  • Question


Holt  Educational Consultant - / 15347  
Jul 29, 2020   #2
You are really shortchanging yourself by writing only 154 words. The best bet you have for scoring better with the Task 1 essay is to write between 175-190 words. That means, you should write about 3 sentences per paragraph, avoiding run on sentences in the process. You did not properly identify the image. It is not a graph. It is a bar graph. You should be specific about the image type because there are several versions of every image provided. By using the specific image name, you will show that you have properly prepared yourself for the test.

What is the measurement value being used? Your summary information could be more complete. Adding it to the first paragraph would have been more appropriate in terms of completing the summary presentation requirement. All of your paragraphs are under developed. You need to add more analysis to your paragraphs. You are not really analyzing the information. You are just presenting the information, without a true explanation or analysis of the data.

The best way to approach the essay would have been to separate the comparative discussions. Paragraph 2 for one sector, paragraph 3 for the other sector. That would have helped you to present a clearer comparison information for data specific to each section.You do not need to try and present both sectors in the same paragraph. That makes the discussion confusing for the reader.
clara2608 2 / 3  
Jul 31, 2020   #3
"In 1918, the households ..."
In this sentence, I think you can change it a little bit to have more linkers. "In 1918, a mere 20 percent of the amount of work was in the owned house while the corresponding figure in the rented apartment was a heft 80 percent.
hyperephania 10 / 27  
Aug 1, 2020   #4
I believe you have wrongly used the tense, which should have been past simple instead of present simple.


Home / Writing Feedback / IETLS Task 1 - The graph includes the proportion of households owned and rented in England and Wales
Do You Need
Academic Writing
or Editing Help?
Need professional help with your assignments? Fill out one of these forms:

Graduate Writing / Editing:
GraduateWriter form ◳

Best Essay Service:
CustomPapers form ◳

Excellence in Editing:
Rose Editing ◳

AI-Paper Rewriting:
Robot Rewrite ◳