As I am going to have an Ielts exam soon, an honest band grade estimation and evaluation would help, thank you in advance for you sincere help.
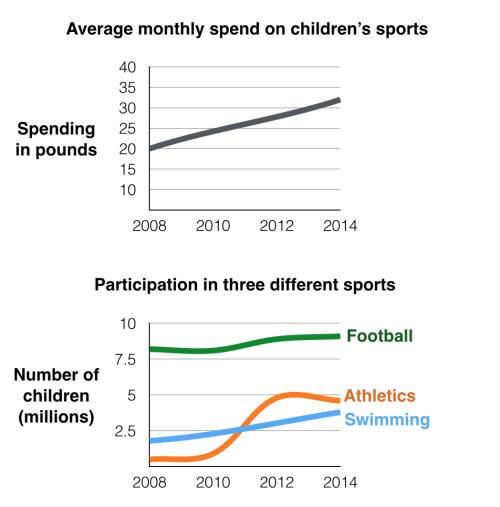
Topic: The first chart below gives information about the money spent by British parents on their children's sports between 2008 and 2014. The second chart shows the number of children who participated in three sports in Britain over the same time period.
The two charts provide information about British children's sports. The first chart lists the changes in the financial support from parents in Britain on kids' sporting activities and the second chart compares British children's participation in three sports.
It is clear that parents' expenditure had risen over the span of six years from 2008 to 2014. Overall, from the second graph, athletics and swimming saw an increase in participation while the figure for football remains steady.
In 2008, the average monthly spending was 20 pounds. The figure experienced a gradual increase over six years and rose to just above 30 pounds in 2014.
Looking at the participation numbers in 2008, around 8 million of children played football while the figures for athletics and swimming is about 2 million and 0.5 million respectively, which was much lower. Within the six years, the number of children participating in football remained steady. On the contrary, the participation figure for athletics witnessed a drastic climb to 5 million in 2012, then fell slightly to just below 5 million in 2014. For swimming, the number of participation increased slowly throughout the whole period and end at about 4 million in 2014, and was overtook by athletics in around 2011.
Word count:204
Topic: The first chart below gives information about the money spent by British parents on their children's sports between 2008 and 2014. The second chart shows the number of children who participated in three sports in Britain over the same time period.
the participation figure for different kind of sports
The two charts provide information about British children's sports. The first chart lists the changes in the financial support from parents in Britain on kids' sporting activities and the second chart compares British children's participation in three sports.
It is clear that parents' expenditure had risen over the span of six years from 2008 to 2014. Overall, from the second graph, athletics and swimming saw an increase in participation while the figure for football remains steady.
In 2008, the average monthly spending was 20 pounds. The figure experienced a gradual increase over six years and rose to just above 30 pounds in 2014.
Looking at the participation numbers in 2008, around 8 million of children played football while the figures for athletics and swimming is about 2 million and 0.5 million respectively, which was much lower. Within the six years, the number of children participating in football remained steady. On the contrary, the participation figure for athletics witnessed a drastic climb to 5 million in 2012, then fell slightly to just below 5 million in 2014. For swimming, the number of participation increased slowly throughout the whole period and end at about 4 million in 2014, and was overtook by athletics in around 2011.
Word count:204

2_line_charts.png
